Radiation dose and gene expression analysis of wild boar 10 years after the Fukushima Daiichi Nuclear Plant accident
Abstract
The Fukushima Daiichi Nuclear Power Plant accident led to contamination with radioactive cesium in an extensive environment in Japan in 2011. We evaluated the concentration of radioactive cesium in the skeletal muscles of 22 wild boars and the expression of IFN-γ, TLR3, and CyclinG1 in the small intestine and compared them with those of wild boar samples collected from Hyogo prefecture. The average 137Cs radioactivity concentration in wild boars in the ex-evacuation zone was 470 Bq/kg. Most of samples still showed radioactivity concentration that exceeded the regulatory limit for foods, but the dose remarkably decreased compared with samples just after the accident. IFN-γ expression was significantly higher in wild boars in the ex-evacuation zone than in samples from Hyogo prefecture. TLR3 expression was also upregulated. CyclinG1 expression also tended to be high. Hence, wild boars might have received some effects of low-dose radiation, and immune cells were activated to some extent. However, pathological examination revealed no inflammatory cell infiltration or pathological damage in the small intestine of wild boars in the ex-evacuation area. Long-term monitoring would be necessary, but we consider that the living body responds appropriately to a stimulus from a contaminated environment.
Introduction
On March 11, 2011, the Great East Japan Earthquake was one of the most significant disasters caused by earthquakes and tsunamis. Moreover, the accident at the Fukushima Daiichi Nuclear Power Plant resulted in widespread contamination of radioactive materials. After the accident, more than 165,000 people were evacuated, but wild and livestock animals were left behind in the evacuation zone at that time. We had earlier investigated the effect of radiation on those animals, and the results were published in several research papers1,2,3,4,5,6 and a book chapter7. However, because the half-life of 137Cesium is approximately 30 years, a long-term environmental survey in the ex-evacuation area is necessary to understand the impact of chronic low-dose radiation on wildlife physiology.
Ten years have elapsed since the earthquake, much of the area where people lived has been decontaminated already, and humans are returning now. Although several people are evacuating, the remaining wild animals are free to live contaminated with radioactive materials. Recent research has revealed that numerous wildlife species are now abundant throughout the ex-evacuation zone8. Hunters in Fukushima have exterminated numerous wild animals, but they are not used for human consumption due to the contamination. Even after the Chernobyl accident, wildlife surveys have reported high radioactive contamination rates in wild boars even after several years9. In a previous research that examined 213 wild boar muscles in Tomioka town, Fukushima Prefecture, in 2019, it was observed that 98.6% of the samples had radioactivity concentration that exceeded the standard value (100 Bq/kg)10 as a general food. Therefore, the meats of those wild boars are not edible and are discarded. However, these wild boars are considered to be affected by low doses of radiation, and analyzing them is important considering the effects on humans.
The physiological functions and immune systems of pigs are extremely similar to those of humans11,12,13. Therefore, we intended to understand the responses in abandoned pigs to radioactive contamination, which can be helpful in understanding the radiation effects and responses in humans. Our previous report demonstrated that there were alterations in gene expression in the small intestine of animals in the ex-evacuation zone after radiation4. The genes involved in inflammation showed significantly higher expression in pigs in the ex-evacuation zone than in control pigs. Therefore, exposed pigs could have an inflammatory response due to oxidative stress with the indirect action of radiation. This is caused by breaking the O–H bonds of water molecules in the body and generating reactive oxygen species14,15. As superoxide and hydroxyl radicals of reactive oxygen species have unpaired electrons, they oxidize DNA, proteins, and lipids16,17,18. Consequently, the biomolecules would be damaged. However, the body has a mechanism to eliminate reactive oxygen species. Nevertheless, if numerous reactive oxygen species are generated by radiation, the elimination will be insufficient, leading to oxidative stress. Chronic inflammation due to oxidative stress is known to induce cancer, lifestyle-related diseases, and immune-related diseases. Therefore, we performed a follow-up investigation using wild boars, which are biologically the same species as pigs, in this study. Muscles and small intestines were collected from the wild boars that were exterminated by the Hunting Association. These samples were evaluated for the amount of radioactive cesium, and the changes in the expression of genes responsible for immunological or physiological functions were analyzed (Fig. 1).

Results
Radioactivity concentration in skeletal muscles and total exposure dose rates of wild boars
Figure 2 shows relationship between the total exposure dose rates and the radioactivity concentration in the skeletal muscles of wild boars. The total exposure dose rates are summation of internal and external dose rates of whole body. Average 137Cs radioactivity concentration and total dose rates in 22 wild boars in the ex-evacuation zone were 470 Bq/kg and 7.2 µGy/d, respectively. The lowest and highest values were 124 and 1667 Bq/kg, respectively. And the medians were 289 Bq/kg and 6.8 µGy/d. In contrast, the average 137Cs radioactivity concentration and total dose rates of the three wild boars in Hyogo prefecture were 1.5 Bq/kg and 0.0 µGy. The lowest and highest values were 0.6 and 2.7 Bq/kg, respectively, and the median was 1.2 Bq/kg.

Gene expressions in the small intestine
In our previous study conducted in 2012, microarray analysis revealed that several genes in the small intestine exhibited significant expression differences after radiation in abandoned pigs. More detailed experiments using real-time PCR confirmed that IFN-γ and TLR3 expressions were significantly increased after radiation in abandoned pigs. Furthermore, our subsequent study of wild boars in the ex-evacuation zone in 2015 showed that CyclinG1 expression was significantly higher than that in the control group4. Therefore, we focused on the expression of IFN-γ, TLR3, and CyclinG1 in the present study as a follow-up survey. We found that IFN-γ and TLR3 expressions were significantly higher in Fukushima wild boars than in Hyogo wild boars. The expression of CyclinG1 also tended to be higher (Fig. 3).

Pathological and morphological changes in the small intestine
In the pathological analysis, tissues were fixed and cut for HE staining to examine whether intestinal tissues were damaged or showed inflammation because of radiation exposure. No morphological changes and infiltration of inflammatory cells were observed (Fig. 4).

Discussion
Although 10 years have elapsed since the earthquake, the reconstruction of the disaster area is in progress. In Fukushima, there are still areas where it is difficult to return home. However, decontamination of urban regions and agricultural land is progressing, and residents are rebuilding their lives. Moreover, agricultural products are sold after being thoroughly inspected for radiation dose and confirmed to be safe. It is the increase in the number of wild animals that threatens the livelihoods of the returning people. From 2016 to 2017, Lyons et al.8 surveyed the ecology of wild animals using network cameras. They found that wildlife preferred the environment without humans and increased in number in the ex-evacuation zone, despite chronic radiation exposure. The wild boar was the most abundant species in the ex-evacuation zone. Even before the Fukushima Daiichi accident, wild boars were targeted for extermination, and the Hunting Association was hunting, but at that time, the meat was also edible in this area. However, it is now just discarded after hunting. The wild boars present in the mountains have not been decontaminated but eat contaminated food and water. Several studies on the Chernobyl accident demonstrated that the pollution of mushrooms in the mountain range continued for a long time19,20.
The intestine can be significantly affected by radiation through internal exposure after oral intake of contaminated food. It is also one of the essential organs of the immune system. Therefore, we evaluated whether the expression of genes responsible for the immune system and cell cycles in the small intestine of wild boars in the ex-evacuation area is altered compared to that in animals in the noncontaminated area.
Our results demonstrated that IFN-γ and TLR3 were significantly upregulated in Fukushima wild boars compared to those in Hyogo wild boars. Moreover, CyclinG1 expression tended to increase. As mentioned earlier, these genes were selected from the microarray analysis in our previous research4. IFN-γ is one of the crucial cytokines for acquired immunity and inflammation. Recently, Zha et al. described that IFN-γ is a master regulator for several cytokines involved in numerous biological processes21. It functions as a master switch to operate cell activation or inhibition. In comparison, the major portion of innate immune cell activation is mediated by TLRs. TLR3 is involved in dsRNA recognition and is associated with antiviral responses. Furthermore, TLR3 is an important molecule for radiation susceptibility. Takemura et al. reported that TLR3-deficient mice exhibited substantial resistance to gastrointestinal syndrome (GIS)22. TLR3 is bound to cellular RNA leaking from damaged cells and induces inflammation. CyclinG1 is one of the target genes of the transcription factor p53 and is induced in response to DNA damage. It also plays a role in G2/M arrest in response to DNA damage recovery and growth promotion after cell stress23. Therefore, the changes in the expressions of the genes encoding these proteins suggested that the immune system and cell cycles in wild boars in the ex-evacuation zone were affected by low-dose radiation. These results are consistent with our previous investigation conducted in 2012. A state of high IFN-γ expression suggests an activated state of immune cells. Despite the low-dose, radiation-induced oxidative stress may result in elevated expression of inflammatory cytokines. However, no correlation was observed between IFN-γ expression and radiation levels in the skeletal muscle of wild boars in this study (data not shown). This could be due to the lower doses of 137Cs observed in the present study rather than those in the previous investigation. Furthermore, pathological examination revealed no infiltration of immune cells in the submucosa of small intestines of wild boars in the ex-evacuation area.
Therefore, the elevated expression of these genes can be considered as a consequence of the living body’s ability to appropriately process the effects of low-dose radiation. The highest radiation concentration in the skeletal muscle was 1667 Bq/kg, which was much lower than that in abandoned pigs investigated in 2012, at > 15,000 Bq/kg on average. Cui et al. investigated 213 wild boars and reported a median 137Cs value of 420 Bq/kg in 201910. Most samples collected from the wild boars in the ex-evacuation zone still showed radioactivity concentration that exceeded the regulatory radiocesium limit for foods in the present study, but the dose is steadily decreasing. Cunningham et al. investigated DNA damage and concluded that there was no evidence of significant harmful impacts to wild boars exposed to low-dose radiation24.
Furthermore, Pederson et al. investigated whether chronic low-dose radiation affects cataract prevalence in wild boars but reported no significantly higher risk in the animals in the exclusion zone25. Finally, we also report the results of this study as a record of 10 years after the accident. Although an increase in the expression of IFN-γ, TLR3, and CyclinG1 was detected, there were no pathological abnormalities in wild boars in the ex-evacuation zone. However, it is difficult to conclude the effects of radiation only ten years after the accident. We intend to continue conducting wild boar surveys regularly to elucidate the effects of long-term low-dose radiation exposure.
Persistent impact of Fukushima decontamination on soil erosion and suspended sediment.
Abstract
In Fukushima, government-led decontamination reduced radiation risk and recovered 137Cs-contaminated soil, yet its long-term downstream impacts remain unclear. Here we provide the comprehensive decontamination impact assessment from 2013 to 2018 using governmental decontamination data, high-resolution satellite images and concurrent river monitoring results. We find that regional erosion potential intensified during decontamination (2013–2016) but decreased in the subsequent revegetation stage. Compared with 2013, suspended sediment at the 1-year-flood discharge increased by 237.1% in 2016. A mixing model suggests that the gradually increasing sediment from decontaminated regions caused a rapid particulate 137Cs decline, whereas no significant changes in downstream discharge-normalized 137Cs flux were observed after decontamination. Our findings demonstrate that upstream decontamination caused persistently excessive suspended sediment loads downstream, though with reduced 137Cs concentration, and that rapid vegetation recovery can shorten the duration of such unsustainable impacts. Future upstream remediation should thus consider pre-assessing local natural restoration and preparing appropriate revegetation measures in remediated regions for downstream sustainability.
Main
Radioactive material leakage from nuclear industry activities or nuclear accidents poses a major threat to the environment and the economy1,2. Historically, widespread radioactive contamination has been observed several times, such as the Kyshtym accident (Soviet Union) in the 1940s–50s3, Windscale accident (England) in 1957 (ref. 4) and Chernobyl accident (Soviet Union) in 1986 (ref. 5). Long-term radiation exposure and radiophobia have increased the health risk and psychological pressure on the people of these regions, resulting in the abandonment of large areas rich in environmental resources and consequently in constrained sustainable human development6,7. As a key means for recovering contaminated regions, mechanical decontamination has been implemented in many legacy sites, including Hanford (United States)8 and Chernobyl9. However, almost all attention has been directed to understanding in situ decontamination effects10,11 and atmospheric particle resuspension issues12 and little is known about if these perturbations would have secondary environmental impacts on their downstream catchments for the long-term.
On 11 March 2011, the most recent large-scale nuclear accident happened at the Fukushima Daiichi Nuclear Power Plant (FDNPP), Japan13. Over 2.7 PBq of fallout 137Cs (half-life T1/2 = 30.1 yr) from the FDNPP was deposited in the terrestrial environment, causing long-term radioactive contamination on large-scale neighbouring catchments13,14. To recover contaminated soil and decrease the exposure dose in Fukushima, the Japanese government evacuated the residents in 2011 and large-scale decontamination was implemented in contaminated villages15,16 in 2012. Within a few years, dramatic land-cover changes occurred in the agricultural regions where 5 cm of the surface soil and vegetation were removed and replaced with uncontaminated soil (Fig. 1), with the subsequent natural restoration promoting revegetation in these decontaminated regions11,13,16.

The effectiveness of such intensive decontamination at reducing radiation exposure in situ is apparent, with air dose rates decreasing by 20–70% after decontamination13. However, as 137Cs can firmly bind to clay minerals, it is transported along with suspended sediments (particulate 137Cs) in the river system to the Pacific Ocean17,18. Comprehensively assessing the impacts of land-use changes in decontaminated regions on the downstream ecosystem is also necessary from the perspective of environmental sustainability. Moreover, recent studies have shown notable differences in the reduction in the particulate 137Cs concentration over time across 30 rivers in Fukushima19,20, further underscoring the need to study land-use impacts on downstream particulate 137Cs discharge into the ocean.
In addition to contaminant migration, land-use changes induced by strong perturbations (for example, decontamination) also alter land–ocean sediment transfer patterns21,22, which in turn affect elemental cycles23, biodiversity24 and global climate25. Systematically assessing the perturbations’ impacts on downstream river suspended sediments (SS) has thus become a joint goal of many related disciplines and a key part of developing science-based catchment management strategies26,27,28,29. However, owing to the limited availability of reliable and concurrent river monitoring data, how downstream river SS variations and land-use changes are linked remains unclear21.
With approximately 11.9% of the watershed area subjected to government-led decontamination between 2013 and early 2017, the Niida River Basin in Fukushima (Fig. 2a)11,30 provides an excellent opportunity to examine the long-term impact on the dynamics of SS and particulate 137Cs in river systems. Previous short-term river studies19,20,31,32,33,34 have suggested an increased river SS load and decreased particulate 137Cs concentrations during decontamination. Several studies that analysed geochemical fingerprints in deposited sediments have implied a significant contribution of sediment sources from the decontaminated regions to the river35,36,37. Yet, given that threats to sustainable catchment management from anthropogenic perturbations are often long-term28,29, more comprehensive and reliable data on quantified land cover and continuous river records are required to explore the effect of decontamination on river SS and particulate 137Cs discharge.

Here we provide a comprehensive assessment of the impacts of land-use changes in decontaminated regions on river SS and particulate 137Cs dynamics, as well as the downstream discharge. We mapped the evolution of decontaminated region boundaries using governmental decontamination documents (Fig. 2b), photographed the land cover in the decontaminated regions using drones and quantified the land-use changes using the normalized difference vegetation index (NDVI) at 10 m spatial resolution. Meanwhile, we conducted a long-term field investigation (Methods and Supplementary Table 1) spanning the decontamination (2013–2016) and natural restoration (2017–2018) stages to continuously record the fluctuations in water discharge and turbidity (10 min temporal resolution) and particulate 137Cs concentrations, both upstream and downstream. Combining the above quantitative data, we systematically reveal that long-term land-use changes in upstream decontaminated regions greatly affect sediment and 137Cs discharge from downstream river systems into the Pacific Ocean.
Land-cover changes in decontaminated regions
Regional decontamination was accomplished in March 2017, spanning over 22.9% and 11.9% of the upstream (Notegami) and downstream (Haramachi) watershed areas, respectively (Fig. 2c). In 2014, agricultural land (18.02 km2) was one of the major land uses in the regions where decontamination was ordered, with a significant increase of over 720% compared with that in 2012. Conversely, the changes in the ordered grassland (1.93 km2) were minimal, with an approximately 26% increase between 2012 and 2014. Given that overall land-cover changes were more pronounced in agricultural lands than in grasslands or residential lands, large-scale agricultural land decontamination may severely alter landscape erodibility and consequently the sediment supply. Moreover, the proximity of the decontaminated agricultural land to rivers increases sediment transport from terrestrial environments.
Drone photographs (Fig. 3a and Supplementary Fig. 1) showed significant land-cover changes in the upstream decontaminated regions. For instance, the agricultural land at the Hiso site (D3, Fig. 3a) was almost bare in August 2016 when the decontamination was completed. However, natural restoration caused the recovery of vegetation during the post-decontamination stage (August 2018). Considering the decontamination sequence and seasonal dependence of the plant growth cycle38, drastic spatiotemporal land-cover changes in the decontamination regions are conceivable.


To quantitatively estimate and compare land-cover changes in the decontaminated regions, we generated NDVI maps in these regions based on the available satellite images from Sentinel 2 and the Moderate Resolution Imaging Spectroradiometer (MODIS) between 2011 and 2018. The comparison between realistic scenarios and Sentinel 2-based NDVI maps (spatial resolution: 10 m) from drone observation sites (Fig. 3a and Supplementary Fig. 1) confirmed the feasibility of NDVI images in distinguishing bare land and agricultural land with vegetation cover. To improve the temporal–spatial resolution of the NDVI dataset, we used the enhanced spatial and temporal adaptive reflectance fusion model (ESTARFM)39 to fuse Sentinel 2 and MODIS maps. Subsequently, we used interpolation to link these newly generated NDVI data (spatial resolution: 10 m) and plotted daily NDVI variations for all decontaminated regions between 2011 and 2018 (Fig. 3b).
In the daily NDVI variation curve, the peak NDVI during 2013–2014 was similar to the pre-decontamination stage (2012) but decreased by approximately 10% in 2016. After decontamination, the peak value presented an increasing trend under the influence of vegetation recovery. However, as the government lifted the evacuation zone after 2017 and allowed the residents to return, vegetation was again removed from some areas planned for agricultural activities in 2018 (Supplementary Fig. 1b). Further analyses of the NDVI variations in the decontaminated regions scheduled in 2012 (Fig. 3c), 2013 (Fig. 3d) and 2014 (Fig. 3e) showed that the NDVI peaks were decreased by approximately 12%, 11% and 15%, respectively, within 2–3 years after decontamination was ordered, thereby providing unambiguous evidence for decreasing vegetation land cover caused by decontamination.
We converted all NDVI maps derived from ESTARFM-images to C × P (cover management and support practice factors, respectively) maps using empirical models40,41. We then estimated erosion potential (that is, K × LS × C × P in the revised Universal Soil Loss Equation (RUSLE); Methods) maps using the LS (slope length and slope steepness factors, respectively) map (Supplementary Fig. 2) and K (soil erodibility) factor in the decontaminated regions. We found that the slopes of decontaminated regions were generally similar for each decontamination-ordered year (Supplementary Fig. 2), suggesting that the erosion potential was consistent with the NDVI in the decontaminated regions. Therefore, we also estimated the daily variation curve of the erosion potential using the mean CP, LS and K factors in the decontaminated regions.
Here we show the ESTARFM-based NDVI (Fig. 3f) and erosion potential (Fig. 3g) during the summer season for each year (specific periods in Supplementary Table 2). NDVI showed a decreasing trend from 2013 to 2016, while the erosion potential peaked in 2016, representing approximately 98% and 52% increases over the pre-decontamination (2011) and natural restoration (2018) stages, respectively. Combining the corresponding NDVI (Supplementary Fig. 3) and erosion potential maps (Supplementary Fig. 4), significant changes in the spatial differences between the land cover and erosion potential during decontamination were also observed.
Response of river SS to land-cover changes
The downstream river SS load (L; Fig. 4a) exhibited a strong correlation with water discharge (Q) during the monitoring periods (Supplementary Fig. 5 and Supplementary Table 3). Under the range of water discharges from 0.1 to 100 m3 s−1, river SS carrying capacity exhibited a considerable increase from 2013 to 2016 and a slight decrease after decontamination (2017 to 2018). Contrastingly, the range of water discharges was relatively narrow upstream, and a steady decrease in SS loads has been observed since 2015. Although the above result suggests an increase in SS supply during the decontamination stage, the high SS carrying capacity in 2015 is not consistent with the actual decontamination progress. Since decontaminated regions tend to be bare land, sediment loads are prone to increasing during rainstorms due to soil erosion. Governmental decontamination plans showed that over 50% of agricultural land decontamination was planned to be implemented in 2016, implying that the erosion potential of the decontaminated regions should have been higher in 2016, rather than in 2015.


The variations in downstream river SS loads over the 6 years (Supplementary Table 4) exhibited a similar trend to peak river SS load in 2015 (126.7 ± 0.3 Gg yr−1). This was an approximately 1,776%, 140% and 215% increase relative to that of 2013, 2016 and 2018, respectively. The historical rainfall records (Fig. 4b) show that the rainfall in September 2015 (551 mm) was more than two-fold greater than that during the same period in 2016 (274 mm), implying that the SS peak may be related to strong runoff. Here we estimate the SS loads at 1-year-flood discharge (Q = 95 m3 s−1) using established L–Q curves, which allow for the comparison of dynamic variations in SS loads under the same flood conditions. In Fig. 4b, a significant increasing trend during the decontamination period is shown, with a 237.1% increase in 2016 compared with 2013. After decontamination, the SS loads drastically decreased by approximately 41% from 2016 to 2017, implying changes in sediment yield and transfer patterns due to natural restoration. These results reveal that river SS loads responded closely to land-cover changes during the study period.
To better explore the response of river SS load to land-cover changes, we extracted river monitoring data during each rainfall event and quantitatively linked the river SS to the corresponding soil loss from the decontaminated regions. We found that SS loads during rainstorms were highly correlated with water discharges in both upstream and downstream areas (Supplementary Fig. 6). Comparing similar rainfall events, significantly greater SS concentrations are observed in 2015–2016 than in other years (Supplementary Figs. 7 and 8). Considering that the land-cover changes induced by decontamination were more pronounced in the summer season, the regression was performed for SS loads between May and October and soil loss during the corresponding period. A more significant correlation was observed (Fig. 4c) between estimated soil loss by RUSLE and SS load upstream (R2 = 0.55, P < 0.01, N = 34) than downstream (R2 = 0.27, P < 0.01, N = 52). Eliminating the effect of rainfall and normalizing by discharge (Fig. 4d) results in a more evident relationship between the erosion potential and SS loads downstream (R2 = 0.35, P < 0.01, N = 52). Overall, these results demonstrate the connection between river SS dynamics and land-cover changes in the decontaminated regions. The short distance between the upstream catchment and decontaminated regions makes soil erosion a critical driver for upstream river SS transport, whereas the downstream river is dependent on long-distance SS transport, making water discharge an important driver for the downstream catchment.
Long-term impact on river SS and 137Cs discharge
From August 2014 to March 2017, the particulate 137Cs concentration in Haramachi exhibited a steep decrease, contrasting remarkably with the limited 137Cs variation observed in the early decontamination stages (January 2013 to August 2014; Fig. 5a). The effective half-life of the particulate 137Cs (eliminated by the natural attenuation factor) during this decontamination period (1.87 yr) was considerably faster than that of physical decay of 137Cs (30.1 yr), the early decontamination period (16.9 yr) and the surrounding contaminated catchments (mean of 4.92 yr)20. Such a sharp decrease in the 137Cs concentration was also observed at the other three monitoring sites (Supplementary Fig. 9a). Because the 137Cs concentration in decontaminated soil was considerably lower than that in the contaminated soil37,42, these results suggest the contribution of sediment from decontaminated regions to the river system. Moreover, strong negative correlations were observed between measured 137Cs levels and decontamination progress at all monitoring sites (Fig. 5b and Supplementary Fig. 9b), which further supports our interpretation. The observed 137Cs concentration increased by approximately 150% in 2018 compared with that at the end of 2016, which may be caused by the weakened sediment supply from decontaminated regions owing to natural restoration and resulting in a relatively increased contribution of sediments from contaminated forest regions13.


Given that the variation in 137Cs concentrations reflects a change in sediment source, the deviations between the measured 137Cs and the natural decrease in 137Cs derived from surrounding contaminated catchments provide a way to quantitatively estimate the contribution of sediment from decontaminated regions (Fig. 5c). In the early decontamination period, our results showed slight variations in the 137Cs concentration (Fig. 5a), which could be attributed to the contribution of sediment from upstream regions with different degrees of contamination. During the main decontamination period, the erosion potential in the summer of 2015 was approximately 22% higher than that in 2014 and the heavy rainfall caused the largest flooding event during the study period (26-year flood). This may result in the sediment from decontaminated regions not being the dominant source for downstream. In 2016, decontamination caused an increase by approximately 59% in the erosion potential compared with 2013, with the contribution percentage steadily increasing over this period to a maximum of 75.7% ± 3.2% (value ± 95% uncertainty). After decontamination, the decreased contribution of sediment from decontaminated regions and the increased 137Cs concentrations can both be attributed to the reduction of soil loss from upstream due to natural restoration.
The 137Cs discharge from contaminated catchments around the Fukushima region into the Pacific Ocean is another ecological issue of global concern. Our data show that the export flux of particulate 137Cs from the downstream of the Niida river (that is, Haramachi) peaked in 2015 (1.24 TBq yr−1, equalling 0.65% 137Cs loss), which is an approximately 667%, 233% and 429% increase relative to that in 2013, 2016 and 2018, respectively (Fig. 5d). Although such 137Cs loss is negligible compared with the terrestrial inventory, it is approximately 105 times greater than that in the pre-Fukushima stage43,44. Accordingly, the dynamic variations in 137Cs discharge from terrestrial environments into the Pacific Ocean, and its drivers, require more attention in the future.
Here we used SS loads at one-year-flood discharge to normalize the 137Cs flux and found its peak occurred in 2015 (Fig. 5e). Additionally, the reduction of the normalized 137Cs flux from 2013 to 2016 (~32%) was similar to natural attenuation in the non-contaminated catchment (~34%) over same period, which may be due to the increased SS load during decontamination offsetting the role of declining 137Cs concentrations in reducing 137Cs emission. During the subsequent natural restoration period, the rapid NDVI increase (Fig. 3f) suggested vegetation recovery in decontaminated regions and a decrease in regional erosion potential (Fig. 3g). This resulted in an approximately 24% decrease in sediment yield from the catchment and an approximately 31% decrease in the contribution of sediment from decontaminated regions (Fig. 5c) from 2016 to 2018. Due to the mutual balance of these effects, there were no significant changes in normalized particulate 137Cs flux in 2018 compared with 2016.
Discussion
Our work highlights the great potential of interdisciplinary analyses for understanding river SS variation and quantifying the contribution of sediment from specific regions. Fukushima decontamination practices, like a controllable validation experiment, justified the reliability of using long-term 137Cs monitoring data for tracing sediment source dynamics due to specific perturbation. Combining the long-term dataset of 137Cs (or other fallout radionuclides) in SS with remote sensing images would provide additional evidence to determine if the changes in the downstream SS transport pattern are linked to the upstream perturbation.
With these interdisciplinary analyses, we systematically reveal how changes in land use in the decontaminated regions significantly influences downstream river SS and 137Cs discharge into the ocean. Indeed, the secondary environmental impacts of surface remediation are being increasingly considered in the broader field concerning remediation of regions contaminated with hazardous materials (for example, heavy metals and organic contaminants)45. The concept of environmental sustainability-centred green remediation has also been brought up in many scenarios46,47. The Fukushima decontamination practice provides evidence showing that mechanical remediation can cause persistently excessive SS load downstream, though it also reduced river 137Cs concentrations. Since persistently excessive turbidity in rivers affects not only surrounding residents’ water use but also trophic level structure in aquatic environments48, the unsustainable downstream impacts caused by upstream decontamination should be highly regarded. The vegetation recovery after land development is highly dependent on local conditions49, and the soil used for decontamination and local high rainfall amount in Fukushima promoted rapid vegetation recovery11,13, which shortened the duration of such unsustainable impacts. Therefore, future upstream contaminated lands that await mechanical remediation need to consider the pre-assessment of local natural restoration conditions or the preparation of appropriate revegetation measures in the catchments’ regulatory frameworks, which would minimize the impact of long-term decontamination on downstream sustainability.
Methods
Study region
The Niida River Basin (265 km2) is located about 40 km northwest of the damaged FDNPP. The topography of its upstream is almost mountainous and its soil types are mainly cambisols and andosols, while fluvisols are the dominant soil type in the downstream plain50. The monitoring data from the Japan Meteorological Agency show that the average rainfall in the Niida River Basin is greater than 1,300 mm, with more than 75% of the rainfall occurring between May and October. According to the third airborne monitoring survey by the Japanese government, the 137Cs inventory in the Niida River Basin was over 700 kBq m−2 (ref. 14). Because of particularly high contamination in its upstream watershed (over 1,000 kBq m−2)51, the government-led decontamination was implemented in the upstream basin from 2013 to 2016 (~1% of the area was extended to March 2017).
Land-cover observation
We constructed the vector decontamination maps based on the paper maps from the Ministry of the Environment, Japan. The boundaries of the decontaminated regions with different land-use types were first outlined by creating polygons using Google Earth. Subsequently, the projections of these polygons were imported to ArcMap v.10.3 to quantitatively evaluate their area.
During the decontamination (2016) and post-decontamination stages (2018), drone photography was utilized (Fig. 2a, triangle) to compare land-cover changes. A commercially available drone (Phantom 4, DJI product) was employed at 100 m above the ground in Matsuzuka (D1; 37.689° N, 140.720° E), Iitoi (D2; 37.663° N, 140.723° E) and Hiso (D3; 37.613° N, 140.711° E) to take photographs.
Quantification of land-cover changes in decontaminated regions
We calculated NDVI within the boundary of the decontaminated regions to quantify the land-cover changes. Through the spectral reflectance dataset in the red (R, nm) and near-infrared (NIR, nm) regions, the NDVI was calculated as52:
NDVI=NIR−RNIR+R.
(1)
The available satellite images from 2011 to 2018 from Sentinel 2 were downloaded from the United States Geological Survey53, while the concurrent MODIS images were derived from the National Aeronautics and Space Administration’s Reverb54. The wavelength bands and spatiotemporal resolutions of the satellite images used here are summarized in Supplementary Tables 5 and 6.
To confirm the reliability of the newly generated NDVI variation curve, NDVIs for the same date as the Sentinel 2 images were estimated using the interpolation and compared with the Sentinel 2-based NDVI. The linear regression analysis showed that the fitting R2 was 0.99 (N = 16, P < 0.01). We also calculated the NDVI in the decontaminated region based on available satellite images of Landsat 5/7/8 (ref. 53) and established a daily NDVI variation curve. The linear regression analysis also showed a high R2 between two daily NDVI curves (R2 = 0.97, N = 2868, P < 0.01). Therefore, these NDVIs calculated by different satellite images confirmed the reliability of the NDVI variation curve based on ESTARFM.
Estimation of erosion potential in decontaminated regions
To link the land-cover changes in decontaminated regions with the soil erosion dynamics, we defined an erosion potential (K × LS × C × P) based on the RUSLE.
The soil loss (A, t ha−1 yr−1) of a specific region can be estimated as55:
A=R×K×LS×C×P,
(2)
where R is the precipitation erosivity factor (MJ mm ha−1 h−1 yr−1), K represents the soil erodibility factor (t h MJ−1 mm−1), L and S are slope length factor (dimensionless) and slope steepness factor (dimensionless), respectively, and C and P are the cover management factor (dimensionless) and support practice factor (dimensionless), respectively. Because these parameters are often set as fixed values, it is difficult to assess the soil loss dynamics during anthropogenic disturbances. To address this problem, we used daily NDVI data to estimate C × P and then considered these dynamic factors in RUSLE.
Wakiyama et al.40 reported a correlation between vegetation cover in Fukushima and the sediment discharges from the standard USLE plot (that is, soil loss, A) that have been normalized by R, K, S and L factors40,56. Therefore, this empirical equation reflects the quantitative relationship between vegetation fractions (VF) and C × P.
To quantify daily C × P changes in decontaminated regions, we first converted the interpolated daily NDVI into the VF by a semi-empirical equation41:
VF=1−(NDVI−NDVI∞NDVIs−NDVI∞)0.6175,
(3)
where NDVIs and NDVI∞ represent the NDVI value for land cover corresponding to no plants and 100% green vegetation cover, respectively. Since these values mainly depend on plant species and soil types, we followed previous methods applied to agricultural land and set NDVIs and NDVI∞ as 0.05 and 0.88, respectively41.
Subsequently, the C × P was estimated by the empirical equation derived from uncultivated farmlands and grasslands (R2 = 0.47, N = 145)40:
C×P=0.083×e−5.666×VF.
(4)
Since the soil type used for decontamination is generally the same, the K factor was set as a constant (0.039; ref. 40). For the LS factor, we downloaded a digital elevation model from the Geospatial Information Authority of Japan (spatial resolution: 10 m) to build an LS map using55:
LS=[Qa×M22.13]y×(0.065+0.045×Sg+0.0065×S2g),
(5)
where Qa is the flow accumulation grid, Sg represents the grid slope as a percentage, M is the grid size and y is a parameter depended on slope steepness. We here used the y values recommended by a published study, ref. 55.
The calculated LS-factor map (Supplementary Fig. 2) showed a relatively consistent LS distribution in space. Based on the ESTARFM-generated satellite images, we compared C × P and erosion potential (K × LS × C × P) and found a significant correlation (R2 = 0.99, P < 0.01, N = 174). Since these results suggest that LS factors in decontaminated regions have a negligible effect on the erosion potential, the mean LS factor and interpolated NDVI based on the daily variation curve (Fig. 3b) were used to estimate the daily erosion potential.
Monitoring of river discharge and turbidity
The water-level gauges (in situ Rugged TROLL100 Data Logger) and a turbidimeter (ANALITE turbidity NEP9530, McVan Instruments) were installed in each monitoring site to continuously recording the water level and turbidity with a temporal resolution of 10 min. As ocean tides may influence the accuracy of water-level monitoring, the Sakekawa site (M4 in Fig. 2) was excluded from the river monitoring programme.
The recorded water level (H, m) was converted to the water discharge (Q, m3 h−1) based on the annual H–Q curves for each monitoring site. These curves were calibrated using a synchronous monitoring dataset of 10-min-resolution water level and discharge provided by the Fukushima prefecture’s official monitoring network57. Because of occasional damage to the water-level gauge at the Haramachi site, the available monitoring data with a temporal resolution of 10 min recorded by the Fukushima prefecture’s official monitoring network57 were used to fill the gaps. The percentages of filling data from official monitoring network were all less than 34% except for 2015 (56.6%). Although similar situations occurred in Notegami, we were unable to fill in gaps with other data due to the lack of a concurrent monitoring network.
The hourly SS concentration (Css, g m−3) at each monitoring site was calculated from the measured turbidity (T, mV) using a calibrated curve20. As the turbidimeter was susceptible to the moss and debris flowing in the river, the dataset was verified with an automated check by HEC-DSSVue (The U.S. Army Corps of Engineers’ Hydrologic Engineering Center Data Storage System) before transforming the data.
The SS load was estimated as the product of the corresponding datasets of discharge and SS concentration, after which we can obtain the annual SS load (L, ton yr−1) by taking the sum:
L=∑(Q×Css).
(6)
We estimated values for gaps including missing and abnormal data through a linear model established by 10-min-resolution monitoring data at the same site. The reliability of the gap-filling strategies used in this study has been documented by Taniguchi et al.19,20 These procedures vastly enhance the possibility of reconstructing the complete dataset. In this study, only the error in converting from water discharge to SS load was considered in the uncertainty assessment, and all estimates were within 0.5% (95% confidential interval) in this case. To reduce the uncertainty of L–Q fitting, the 10-min monitoring dataset (discharge and SS load) was transformed to a 1-hour dataset.
Considering the river SS is often transported by discharge, we used downstream L–Q curves to estimate river SS loads at 1-year-flood discharge (Q = 95 m3 s−1), which eliminates the influence caused by different annual water discharges. The 1-year-flood discharge was calculated from the daily maximum discharge data from 1 January 2013 to 30 September 2020 at the Haramachi site.
To compare river SS dynamics during rainfall events, we here defined a rainfall event as the increase in water discharge exceeding 1.4 and 1.6 times the baseflow before precipitation for the upstream and downstream catchments, respectively. As a result, a total of 64 and 72 rainfall events from the Notegami and Haramachi sites were identified.
To study the dynamic relationship between soil loss from decontaminated regions and river SS load, we estimated eroded soil amount during each rainstorm using RUSLE. Specifically, the NDVI during a specific rainfall was determined by interpolation. Subsequently, the corresponding C × P can be estimated using equations (3) and (4). With the mean values of the K and LS factors, the erosion potential can then be calculated. Finally, precipitation erosivity factor (Supplementary Table 7) for each rainfall event can be calculated as58:
R=1n∑j=1n∑k=1mj(EI30)k,
(7)
where n is the number of years used, mj is the number of precipitation events in each given year j and E and I30 represent each event’s kinetic energy (MJ) and maximum 30 min precipitation intensity (mm h−1), respectively, for each event k. The event’s erosivity, EI30, can be calculated as58:
EI30=(∑r=10ervr)I30,
(8)
where er denotes the unit rainfall energy (MJ ha−1 mm−1) and vr provides the rainfall volume during a set period (r) (mm). For this calculation, the criterion for the identification of a precipitation event is consistent with previous work, that is, the cumulative rainfall of an event is greater than 12.7 mm (ref. 58). If another rainfall event occurs within 6 h of the end of a rainfall event, they are counted as one event. Therefore, the unit rainfall energy (er) can be derived for each time interval based on rainfall intensity (ir, mm h−1)58:
er=0.29[1−0.72e(−0.05×ir)].
(9)
The calculation’s required parameters were derived from the historical precipitation record from the Japan Meteorological Agency59. For the Notegami catchment, the precipitation monitoring data were derived from Iitate. For the Haramachi catchment, the precipitation was obtained from three adjacent monitoring sites (that is, Haramachi, Iitate and Tsushima) with the specific weights of 0.143, 0.545 and 0.312, respectively. These weights were determined by the Voronoi diagram method in a Geographic Information System60.
River monitoring of particulate 137Cs
At each monitoring site, the suspended sediment sampler proposed by Phillips et al.61 was installed at 20–30 cm above the riverbed for the time‐integrated sampling of river suspended sediment. The reliability of this sampler has been widely proven in past studies19,20. After sampling, the trapped turbid water and SS samples were transferred into a clean polyethylene container and stored until laboratory analysis.
The SS samples were separated from the collected water mixture via natural precipitation and physical filtration, dried at 105 °C for 24 h and subsequently packed into a plastic container. The activities of 137Cs in the SS samples (C, Bq kg−1) were determined via the measurement system, which consists of a high-purity germanium γ-ray spectrometer (GCW2022S, Canberra−Eurisys, Meriden) coupled to an amplifier (PSC822, Canberra, Meriden) and multichannel analyser (DSA1000, Canberra, Meriden). The measurement system was calibrated with the standard soil sample from the International Atomic Energy Agency. Under the 662 keV energy channel, each measurement batch would take approximately 1–24 h to make the analytical precision of the measurements within 10% (95% confidential interval). All measured 137Cs concentrations were decay-corrected to their sampling date. Moreover, the results obtained in this study were also normalized by their initial average 137Cs inventory in the catchment (D, Bq m−2) to eliminate the effect caused by spatial differences.
As 137Cs concentration in the sediment sample depends on particle size19,20, we conducted a particle size correction for all measured data in Takase, Ukedo and Haramachi to eliminate this effect. The particle size distributions for dried SS samples were analysed using the laser diffraction particle size analyser (SALD-3100, Shimadzu Co., Ltd.). With the parameterized particle size distributions, the particle size correction coefficient (Pc) can be calculated by19:
Pc=(SsSr)v,
(10)
where Sr and Ss represent the reference and collected samples’ specific surface areas (m2 g−1). The exponent coefficient, v, is a fitting parameter associated with chemical and mineral compositions. In this study, the same parameters measured in the Abukuma River, the major river in the Fukushima area, were applied for Sr (0.202 m2 g−1) and v (0.65). The specific surface area for collected SS samples was estimated by the following equation under a spherical approximation20:
Ss=∑(6×ρ−1×d−1i×p−1i),
(11)
where ρ is the particle density and di and pi denote the ratio and diameter of the particle size fraction for particle i. Therefore, the 137Cs concentration corrected for particle size can be obtained by dividing the measured 137Cs concentration by Pc.
Considering that the decrease in particulate 137Cs concentration in a catchment was also affected by natural attenuation, there is a need to eliminate this effect from the declining trend of our observed 137Cs dataset to highlight the impacts of decontamination. The Ukedo and Takase are rivers surrounding the Niida River with similar contaminated situations. Our long-term 137Cs monitoring data from downstream of these two catchments showed that their 137Cs decline trends were relatively steady. Although there is a dam reservoir upstream of Ukedo, the 137Cs concentration observed both upstream and downstream showed a similar declining trend62. Therefore, the above evidence suggests that natural attenuation was the dominant factor controlling the 137Cs decrease in these two rivers. Here we assumed that the natural attenuation trend of 137Cs in the surrounding catchments (Ukedo and Takase) with little effect by decontamination was similar to that of the Haramachi catchment. Thus, we fitted their time change curves of 137Cs concentration (normalized by average 137Cs inventory of the corresponding catchment) using an exponential model. We then estimated the 137Cs concentration at the same sampling time as Haramachi in the two catchments by using the fitting models. Finally, we calculated the mean value of the two datasets and recalculated the effective half-life (Teff = ln(2)/λ; λ is the fitting exponential term) of the natural attenuation by the exponential model.
The 137Cs flux (LCs, Bq) for each monitoring site was estimated by the product of the SS flux and the 137Cs concentration in the suspended sediment sample. We then took the sum over that year:
LCs=∑(Q×Css×C).
(12)
According to the law of error propagation, we considered the error from SS load and 137Cs measurement in the combined uncertainty assessment for 137Cs fluxes and found their values are all within 1.1% (95% confidential interval).
Using 137Cs as a tracer in estimating SS source contribution
Although 137Cs has been widely used in tracing sediment source, the spatial variability of the 137Cs deposition inventory in the Fukushima catchment hinders the estimation of the source contribution from a specific region. However, for the decontaminated catchments, as the 137Cs concentration in decontaminated soil was much lower than that in contaminated regions (for example, forested regions and the riverbank)11,13,63, the fluctuations in the particulate 137Cs concentration can help to identify the sediment from the decontamination regions. Specifically, we assumed that the particulate 137Cs concentrations in surrounding contaminated watersheds (that is, having similar land-use composition) follow a similar decline trend driven by natural reasons, while the decontamination-induced land-cover changes cause other sediment sources to mix with the original river SS and thus result in a deviation in observed 137Cs concentrations from this natural trend. Therefore, the relative contribution (RC) of the specific sediment source can be expressed as:
RC=(Cm−Cn)(Cs−Cn),
(13)
where the Cm is the measured 137Cs concentration and Cs and Cn represent the 137Cs concentration in a specific sediment source and the naturally varied 137Cs concentration at the same time as the measured 137Cs. For data comparability, all 137Cs concentrations presented here were corrected by their particle size and 137Cs inventory. We also excluded the samples with collection weights below 0.5 g from the calculations due to their high uncertainty in Pc measurement.
In this study, the specific sediment source is the decontaminated soil in the Niida River Basin where the 137Cs concentration was approximately 53.99 ± 40.90 Bq kg−1 (refs. 37,42; mean ± standard deviation, N = 8). The natural decline of the 137Cs concentration (that is, λ) was established using temporal variation in 137Cs data originating from the Ukedo and Takase rivers, which were scarcely influenced by decontamination. The first measured 137Cs data in Haramachi were set as the starting point of its natural decline curve. The total uncertainty for the contribution percentage of SS from the decontaminated regions was calculated by the propagation of error from each part with the uncertainties originating from the measured 137Cs concentration, 137Cs concentration in a specific source and the natural 137Cs concentration. For the uncertainty in the 137Cs concentration in decontaminated soil (Cs), we set the standard deviation as its error source, while the natural 137Cs concentrations were calculated by the propagation of the 95% confidential interval of the fitting curves.
Reporting summary
Further information on research design is available in the Nature Research Reporting Summary linked to this article.
Data availability
Ordered decontamination process data are available from http://josen.env.go.jp/plaza/info/weekly/weekly_190607.html. Particulate 137Cs monitoring data in Haramachi, Takase and Ukedo during 2012–2017 are available from: https://doi.org/10.34355/Fukushima.Pref.CEC.00014, https://doi.org/10.34355/CRiED.U.Tsukuba.00020 and https://doi.org/10.34355/Fukushima.Pref.CEC.00021. The rest of data presented in this study are available from the corresponding author upon request.
References
- Anspaugh, L. R., Catlin, R. J. & Goldman, M. The global impact of the Chernobyl reactor accident. Science 242, 1513–1519 (1988).CAS Article Google Scholar
- Ten Hoeve, J. E. & Jacobson, M. Z. Worldwide health effects of the Fukushima Daiichi nuclear accident. Energy Environ. Sci. 5, 8743–8757 (2012).Article CAS Google Scholar
- Shagina, N. B. et al. Reconstruction of the contamination of the Techa River in 1949–1951 as a result of releases from the “MAYAK” Production Association. Radiat. Environ. Biophys. 51, 349–366 (2012).CAS Article Google Scholar
- Jones, S. Windscale and Kyshtym: a double anniversary. J. Environ. Radioact. 99, 1–6 (2008).CAS Article Google Scholar
- Beresford, N. A. et al. Thirty years after the Chernobyl accident: what lessons have we learnt? J. Environ. Radioact. 157, 77–89 (2016).CAS Article Google Scholar
- Steinhauser, G., Brandl, A. & Johnson, T. E. Comparison of the Chernobyl and Fukushima nuclear accidents: a review of the environmental impacts. Sci. Total Environ. 470–471, 800–817 (2014).Article CAS Google Scholar
- Fesenko, S. V. et al. An extended critical review of twenty years of countermeasures used in agriculture after the Chernobyl accident. Sci. Total Environ. 383, 1–24 (2007).CAS Article Google Scholar
- Poston, T. M., Peterson, R. E. & Cooper, A. T. Past radioactive particle contamination in the Columbia River at the Hanford site, USA. J. Radiol. Prot. 27, A45 (2007).CAS Article Google Scholar
- Voitsekhovitch, O., Nasvit, O., Los’y, I. & Berkovsky, V. Present thoughts on the aquatic countermeasures applied to regions of the Dnieper River catchment contaminated by the 1986 Chernobyl accident. Stud. Environ. Sci. 68, 75–85 (1997).Article Google Scholar
- Ramzaev, V., Barkovsky, A., Mishine, A., Andersson, K. G. & Well-being, H. Decontamination tests in the recreational areas affected by the Chernobyl accident: efficiency of decontamination and long-term stability of the effects. J. Soc. Remediat. Radioact. Contam. Environ. 1, 93–107 (2013). Google Scholar
- Evrard, O., Patrick Laceby, J. & Nakao, A. Effectiveness of landscape decontamination following the Fukushima nuclear accident: a review. Soil 5, 333–350 (2019).CAS Article Google Scholar
- Kinase, T. et al. The seasonal variations of atmospheric 134,137Cs activity and possible host particles for their resuspension in the contaminated areas of Tsushima and Yamakiya, Fukushima, Japan. Prog. Earth Planet. Sci. 5, 12 (2018).
- Onda, Y. et al. Radionuclides from the Fukushima Daiichi Nuclear Power Plant in terrestrial systems. Nat. Rev. Earth Environ. 1, 644–660 (2020).CAS Article Google Scholar
- Kato, H., Onda, Y., Gao, X., Sanada, Y. & Saito, K. Reconstruction of a Fukushima accident-derived radiocesium fallout map for environmental transfer studies. J. Environ. Radioact. 210, 105996 (2019).CAS Article Google Scholar
- Remediation of Contaminated Areas in the Aftermath of the Accident at the Fukushima Daiichi Nuclear Power Station. Overview, Analysis and Lessons Learned. Part 1. A Report on the “Decontamination Pilot Project” (Japan Atomic Energy Agency, 2015); https://jopss.jaea.go.jp/pdfdata/JAEA-Review-2014-051.pdf
- Decontamination Guidelines 2nd edn (Ministry of the Environment, 2013); http://josen.env.go.jp/en/%0Aframework/pdf/decontamination_guidelines_2nd.pdf
- Iwagami, S. et al. Temporal changes in dissolved 137Cs concentrations in groundwater and stream water in Fukushima after the Fukushima Dai-ichi Nuclear Power Plant accident. J. Environ. Radioact. 166, 458–465 (2017).CAS Article Google Scholar
- Aoyama, M., Tsumune, D., Inomata, Y. & Tateda, Y. Mass balance and latest fluxes of radiocesium derived from the Fukushima accident in the western North Pacific Ocean and coastal regions of Japan. J. Environ. Radioact. 217, 106206 (2020).CAS Article Google Scholar
- Taniguchi, K. et al. Transport and redistribution of radiocesium in Fukushima fallout through rivers. Environ. Sci. Technol. 53, 12339–12347 (2019).CAS Article Google Scholar
- Taniguchi, K. et al. Dataset on the 6-year radiocesium transport in rivers near Fukushima Daiichi Nuclear Power Plant. Sci. Data 7, 433 (2020).
- Walling, D. E. Human impact on land–ocean sediment transfer by the world’s rivers. Geomorphology 79, 192–216 (2006).Article Google Scholar
- Borrelli, P. et al. An assessment of the global impact of 21st century land use change on soil erosion. Nat. Commun. 8, 2013 (2017).
- Piao, S. et al. Changes in climate and land use have a larger direct impact than rising CO2 on global river runoff trends. Proc. Natl Acad. Sci. USA 104, 15242–15247 (2007).CAS Article Google Scholar
- Jung, M., Rowhani, P. & Scharlemann, J. P. W. Impacts of past abrupt land change on local biodiversity globally. Nat. Commun. 10, 5474 (2019).
- Borrelli, P. et al. Land use and climate change impacts on global soil erosion by water (2015–2070). Proc. Natl Acad. Sci. USA 117, 21994–22001 (2020).CAS Article Google Scholar
- Overeem, I. et al. Substantial export of suspended sediment to the global oceans from glacial erosion in Greenland. Nat. Geosci. 10, 859–863 (2017).CAS Article Google Scholar
- Giam, X., Olden, J. D. & Simberloff, D. Impact of coal mining on stream biodiversity in the US and its regulatory implications. Nat. Sustain. 1, 176–183 (2018).Article Google Scholar
- Hackney, C. R. et al. River bank instability from unsustainable sand mining in the lower Mekong River. Nat. Sustain. 3, 217–225 (2020).Article Google Scholar
- Wang, S. et al. Reduced sediment transport in the Yellow River due to anthropogenic changes. Nat. Geosci. 9, 38–41 (2016).CAS Article Google Scholar
- Environmental Remediation (Ministry of the Environment, Government of Japan, 2021); http://josen.env.go.jp/en/decontamination/
- Niizato, T. & Watanabe, T. 137Cs outflow from forest floor adjacent to a residential area: comparison of decontaminated and non-decontaminated forest floor. Glob. Environ. Res. 24, 129–136 (2021); http://www.airies.or.jp/ebook/Global_Environmental_Research_Vol.24No.2.pdf Google Scholar
- Sakuma, K. et al. Evaluation of sediment and 137Cs redistribution in the Oginosawa River catchment near the Fukushima Dai-ichi Nuclear Power Plant using integrated watershed modeling. J. Environ. Radioact. 182, 44–51 (2018).CAS Article Google Scholar
- Iwagami, S. et al. Six-year monitoring study of 137Cs discharge from headwater catchments after the Fukushima Dai-ichi Nuclear Power Plant accident. J. Environ. Radioact. 210, 106001 (2019).CAS Article Google Scholar
- Ochiai, S. et al. Effects of radiocesium inventory on 137Cs concentrations in river waters of Fukushima, Japan, under base-flow conditions. J. Environ. Radioact. 144, 86–95 (2015).CAS Article Google Scholar
- Evrard, O. et al. Impact of the 2019 typhoons on sediment source contributions and radiocesium concentrations in rivers draining the Fukushima radioactive plume, Japan. Collect. C. R. Geosci. 352, 199–211 (2020). Google Scholar
- Evrard, O. et al. Quantifying the dilution of the radiocesium contamination in Fukushima coastal river sediment (2011–2015). Sci. Rep. 6, 34828 (2016).
- Evrard, O. et al. Radionuclide contamination in flood sediment deposits in the coastal rivers draining the main radioactive pollution plume of Fukushima Prefecture, Japan (2011–2020). Earth Syst. Sci. Data 13, 2555–2560 (2021).Article Google Scholar
- Chu, H., Venevsky, S., Wu, C. & Wang, M. NDVI-based vegetation dynamics and its response to climate changes at Amur-Heilongjiang River Basin from 1982 to 2015. Sci. Total Environ. 650, 2051–2062 (2019).CAS Article Google Scholar
- Zhu, X., Chen, J., Gao, F., Chen, X. & Masek, J. G. An enhanced spatial and temporal adaptive reflectance fusion model for complex heterogeneous regions. Remote Sens. Environ. 114, 2610–2623 (2010).Article Google Scholar
- Wakiyama, Y., Onda, Y., Yoshimura, K., Igarashi, Y. & Kato, H. Land use types control solid wash-off rate and entrainment coefficient of Fukushima-derived 137Cs, and their time dependence. J. Environ. Radioact. 210, 105990 (2019).CAS Article Google Scholar
- Gao, L. et al. Remote sensing algorithms for estimation of fractional vegetation cover using pure vegetation index values: a review. ISPRS J. Photogramm. Remote Sens. 159, 364–377 (2020).Article Google Scholar
- Nemoto, T. & Matsuki, N. Soil Stratification Survey on Farmland Soil after Decontamination in Iitate Village (in Japanese) (Fukushima Agricultural Technology Centre, 2015).
- Wakiyama, Y., Onda, Y., Mizugaki, S., Asai, H. & Hiramatsu, S. Soil erosion rates on forested mountain hillslopes estimated using 137Cs and 210Pbex. Geoderma 159, 39–52 (2010).Article Google Scholar
- Fukuyama, T., Takenaka, C. & Onda, Y. 137Cs loss via soil erosion from a mountainous headwater catchment in central Japan. Sci. Total Environ. 350, 238–247 (2005).CAS Article Google Scholar
- Hou, D., Gu, Q., Ma, F. & O’Connell, S. Life cycle assessment comparison of thermal desorption and stabilization/solidification of mercury contaminated soil on agricultural land. J. Clean. Prod. 139, 949–956 (2016).CAS Article Google Scholar
- Ding, D., Song, X., Wei, C. & LaChance, J. A review on the sustainability of thermal treatment for contaminated soils. Environ. Pollut. 253, 449–463 (2019).CAS Article Google Scholar
- Hou, D. & Al-Tabbaa, A. Sustainability: a new imperative in contaminated land remediation. Environ. Sci. Policy 39, 25–34 (2014).Article Google Scholar
- Kemp, P., Sear, D., Collins, A., Naden, P. & Jones, I. The impacts of fine sediment on riverine fish. Hydrol. Process. 25, 1800–1821 (2011).Article Google Scholar
- Copeland, S. M., Munson, S. M., Bradford, J. B. & Butterfield, B. J. Influence of climate, post-treatment weather extremes, and soil factors on vegetation recovery after restoration treatments in the southwestern US. Appl. Veg. Sci. 22, 85–95 (2019).Article Google Scholar
- Lepage, H. et al. Investigating the source of radiocesium contaminated sediment in two Fukushima coastal catchments with sediment tracing techniques. Anthropocene 13, 57–68 (2016).Article Google Scholar
- Delmas, M., Garcia-Sanchez, L., Nicoulaud-Gouin, V. & Onda, Y. Improving transfer functions to describe radiocesium wash-off fluxes for the Niida River by a Bayesian approach. J. Environ. Radioact. 167, 100–109 (2017).CAS Article Google Scholar
- E. I. Jazouli, A. et al. Soil erosion modeled with USLE, GIS, and remote sensing: a case study of Ikkour watershed in Middle Atlas (Morocco). Geosci. Lett. 4, 25 (2017).
- EarthExplorer (USGS, accessed November 2021); https://earthexplorer.usgs.gov/
- EARTHDATA SEARCH (NASA, accessed November 2021); https://search.earthdata.nasa.gov/search?lat=-0.0703125
- Ganasri, B. P. & Ramesh, H. Assessment of soil erosion by RUSLE model using remote sensing and GIS—a case study of Nethravathi Basin. Geosci. Front. 7, 953–961 (2016).Article Google Scholar
- Yoshimura, K., Onda, Y. & Kato, H. Evaluation of radiocaesium wash-off by soil erosion from various land uses using USLE plots. J. Environ. Radioact. 139, 362–369 (2015).CAS Article Google Scholar
- River Monitoring Network in Fukushima Prefecture (Fukushima Prefecture, accessed November 2021); http://kaseninf.pref.fukushima.jp/gis/
- Panagos, P. et al. Rainfall erosivity in Europe. Sci. Total Environ. 511, 801–814 (2015).CAS Article Google Scholar
- Historical Meteorological Record (Japan Meteorological Agency, accessed November 2021); https://www.jma.go.jp/jma/indexe.html
- Di, Z. W. et al. Centroidal Voronoi tessellation based methods for optimal rain gauge location prediction. J. Hydrol. 584, 124651 (2020).Article Google Scholar
- Phillips, J. M., Russell, M. A. & Walling, D. E. Time-integrated sampling of fluvial suspended sediment: a simple methodology for small catchments. Hydrol. Process. 14, 2589–2602 (2000).Article Google Scholar
- Funaki, H., Sakuma, K., Nakanishi, T., Yoshimura, K. & Katengeza, E. W. Reservoir sediments as a long-term source of dissolved radiocaesium in water system; a mass balance case study of an artificial reservoir in Fukushima, Japan. Sci. Total Environ. 743, 140668 (2020).CAS Article Google Scholar
- Laceby, J. P., Huon, S., Onda, Y., Vaury, V. & Evrard, O. Do forests represent a long-term source of contaminated particulate matter in the Fukushima Prefecture? J. Environ. Manage. 183, 742–753 (2016).
Acknowledgements
We appreciate B. Matsushita for his valuable suggestions on satellite image processing and NDVI calculation, J. Chen for sharing the code for ESTARFM, J. Takahashi for sharing 137Cs in decontaminated soil data, H. Kato for his suggestions on presenting the results, S. Fujiwara for his assistance on calculating the precipitation erosivity factor, Y. Yamanaka and T. Kubo for their work on decontamination map development, field investigation and preliminary data analysis and Y. He and F. Yoshimura for their constructive suggestions on improving figure quality. We also acknowledge funding support from the commissioned study from the Ministry of Education, Culture, Sports, Science and Technology (MEXT) FY2011–2012, Nuclear Regulation Authority FY2013–2014, Japan Atomic Energy Agency-funded FY2015–2021, Grant-in-Aid for Scientific Research on Innovative Areas grant number 24110005, Grant-in-Aid for Scientific Research (A) 22H00556, Agence Nationale de la Recherche ANR-11-RSNR-0002 and the Japan Science and Technology Agency as part of the Belmont Forum.
Author information
Authors and Affiliations
- Center for Research in Isotopes and Environmental Dynamics, University of Tsukuba, Tsukuba, Japan Bin Feng, Yuichi Onda, Asahi Hashimoto & Yupan Zhang
- Institute of Environmental Radioactivity, Fukushima University, Fukushima, JapanYoshifumi Wakiyama
- National Institute of Technology, Tsuyama College, Tsuyama, JapanKeisuke Taniguchi
Contributions
B.F. and Y.O. conceived the study; B.F. performed the data evaluation and all analyses, interpreted the data, wrote the manuscript and prepared all figures and tables in close discussion with Y.O.; Y.O. provided funding support for the field monitoring and all needed resources; K.T. and Y.Z outlined the boundary of the decontamination regions and implemented the drone observations of the sites; and Y.W. and K.T. performed the field river monitoring and determined the particulate 137Cs concentration. B.F., A.H. and Y.Z. prepared all satellite images, ran the NDVI calculation and processed ESTARFM. All listed authors contributed to the editing of the manuscript and approved the final version.
Decadal trends in 137Cs concentrations in the bark and wood of trees contaminated by the Fukushima nuclear accident.
Abstract
Understanding the actual situation of radiocesium (137Cs) contamination of trees caused by the Fukushima nuclear accident is essential for predicting the future contamination of wood. Particularly important is determining whether the 137Cs dynamics within forests and trees have reached apparent steady state. We conducted a monitoring survey of four major tree species (Japanese cedar, Japanese cypress, konara oak, and Japanese red pine) at multiple sites. Using a dynamic linear model, we analyzed the temporal trends in 137Cs activity concentrations in the bark (whole), outer bark, inner bark, wood (whole), sapwood, and heartwood during the 2011–2020 period. The activity concentrations were decay-corrected to September 1, 2020, to exclude the decrease due to the radioactive decay. The 137Cs concentrations in the whole and outer bark samples showed an exponential decrease in most plots but a flat trend in one plot, where 137Cs root uptake is considered to be high. The 137Cs concentration ratio (CR) of inner bark/sapwood showed a flat trend but the CR of heartwood/sapwood increased in many plots, indicating that the 137Cs dynamics reached apparent steady state within one year in the biologically active parts (inner bark and sapwood) and after several to more than 10 years in the inactive part (heartwood). The 137Cs concentration in the whole wood showed an increasing trend in six plots. In four of these plots, the increasing trend shifted to a flat or decreasing trend. Overall, the results show that the 137Cs dynamics within forests and trees have reached apparent steady state in many plots, although the amount of 137Cs root uptake in some plots is possibly still increasing 10 years after the accident. Clarifying the mechanisms and key factors determining the amount of 137Cs root uptake will be crucial for predicting wood contamination.
Introduction
After the Fukushima Dai-ichi Nuclear Power Plant (FDNPP) accident in March of 2011, a wide area of forests in eastern Japan was contaminated with radionuclides. In particular, radiocesium (137Cs) has the potential to threaten the forestry and wood production in the contaminated area for many decades because it was released in large amounts (10 PBq)1 and has a relatively long half-life (30 years). Radiocesium levels for some wood uses are strictly regulated in Japan (e.g., 40 Bq kg−1 for firewood2 and 50 Bq kg−1 for mushroom bed logs3), meaning that multipurpose uses of wood from even moderately contaminated areas are restricted. Although a guidance level of radiocesium in construction wood has not been declared in Japan, the permissible levels in some European countries (370–740 Bq kg−1)4,5,6 suggest that logging should be precautionary within several tens of kilometers from the FDNPP, where the 137Cs activity concentration in wood potentially exceeds 1,000 Bq kg−1 [refs. 7,8]. To determine whether logging should proceed, the long-term variation in wood 137Cs concentration must be predicted as accurately as possible. Many simulation models successfully reproduce the temporal variations in the early phase after the FDNPP accident, but produce large uncertainties in long-term predictions9. To understand the 137Cs dynamics in forests and trees and hence refine the prediction models, it is essential to provide and analyze the observational data of 137Cs activity concentrations in tree stem parts.
Accident-derived 137Cs causes two types of tree contamination: direct contamination by 137Cs fallout shortly after the accident, and indirect contamination caused by surface uptake from directly contaminated foliage/bark10,11 and root uptake from contaminated soil12. The 137Cs concentration in bark that pre-exists the accident was affected by both 137Cs drop/wash off from bark surfaces and 137Cs uptake because the bark consists of a directly contaminated outer bark (rhytidome) and an indirectly contaminated inner bark (phloem). Given that the 137Cs content was 10 times higher in the outer bark than in the inner bark in 201213 and the 137Cs concentration in the whole bark decreased during the 2011–2016 period at many study sites8, the temporal variation in the whole bark 137Cs concentration during the early post-accident phase must be mainly contributed by drop/wash off of 137Cs on the outer bark surface.
In contrast, stem wood (xylem) covered by bark was contaminated only indirectly. Although 137Cs distribution in sapwood (outer part of stem wood; containing living cells) and heartwood (inner part of stem wood; containing no living cells) is non-uniform and species-specific8,13,14,15, the 137Cs concentration in whole wood depends on the amount of 137Cs uptake. Because the dissolvable 137Cs on the foliar/bark surface decreased significantly within 201116, the main route of 137Cs uptake since 2012 is likely root uptake rather than surface uptake. A monitoring survey during 2011–2016 showed that the temporal trend in the whole wood 137Cs concentration can be increasing, decreasing, or flat8, suggesting that 137Cs root uptake widely differs among sites and species.
Meanwhile, many simulation models have predicted an initial increase in the whole wood 137Cs concentration after the accident, followed by a gradual decline9. The initial increase is attributable to the increase in soil 137Cs inventory, and the following decline is mainly attributed to radioactive decay, dilution by wood biomass increment, and immobilization in the soil. Therefore, the trend shift from increasing to decreasing is a good indicator that shows the 137Cs dynamics within the forest have reached apparent steady state, which is characterized by slower changes in 137Cs concentration, bioavailability, and partitioning in the forest12,17,18. However, the timing of the trend shift predicted by the models have large uncertainty, varying from several years to a few decades from the accident9. Moreover, the trend shift has not been confirmed by observational data after the FDNPP accident. Although our monitoring survey cannot easily identify the key driving factors of the temporal trends, it can directly discern the trend shift from increasing to decreasing, and the timeframe of the increasing trend. The confirmation of the trend shift will accelerate the understanding of key factors of 137Cs root uptake, because important parameters such as transfer factor and CR are originally defined for a steady state condition18.
The present study aims to clarify the temporal trends of 137Cs concentrations in bark and wood of four major tree species (Japanese cedar, Japanese cypress, konara oak, and Japanese red pine) at multiple sites during the 10 years following the FDNPP accident. Detecting a trend shift from increasing to decreasing in the wood 137Cs concentration was especially important to infer whether the 137Cs dynamics within the forest have reached apparent steady state. We update Ohashi et al.8, who analyzed the monotonous increasing or decreasing trends during 2011–2016, with observational data of 2017–2020 and a more flexible time-series analysis using a dynamic linear model (DLM). The DLM is suitable for analyzing data including observational errors and autocorrelation, and has the advantage of being applicable to time-series data with missing years. For a more detailed understanding of bark contamination and the 137Cs dynamics in tree stems, we also newly provide data on the 137Cs concentrations in the outer and inner barks. The temporal trends in the 137Cs CRs of outer bark/inner bark, heartwood/sapwood, and inner bark/sapwood were analyzed to confirm whether the 137Cs dynamics within the trees have reached apparent steady state.
Materials and methods
Monitoring sites and species
The monitoring survey was conducted at five sites in Fukushima Prefecture (sites 1–4 and A1) and at one site in Ibaraki Prefecture (site 5), Japan (Fig. 1). Sites 1, 2, and A1 are located in Kawauchi Village, site 3 in Otama Village, site 4 in Tadami Town, and site 5 in Ishioka City. Monitoring at sites 1–5 was started in 2011 or 2012, and site A1 was additionally monitored since 2017. The tree species, age, mean diameter at breast height, initial deposition density of 137Cs, and sampling year of each sample at each site are listed in Table 1. The dominant tree species in the contaminated area, namely, Japanese cedar (Cryptomeria japonica [L.f.] D.Don), Japanese cypress (Chamaecyparis obtusa [Siebold et Zucc.] Endl.), konara oak (Quercus serrata Murray), and Japanese red pine (Pinus densiflora Siebold et Zucc.) were selected for monitoring. Japanese chestnut (Castanea crenata Siebold et Zucc.) was supplementally added in 2017. The cedar, cypress, and pine are evergreen coniferous species, and the oak and chestnut are deciduous broad-leaved species. Sites 1 and 3 each have three plots, and each plot contains a different monitoring species. Site A1 has one plot containing two different monitoring species, and the remaining sites each have one plot with one monitoring species, giving ten plots in total.


Sample collection and preparation
Bulk sampling of bark and wood disks was conducted by felling three trees per year at all sites during 2011–20168,25 and at sites 3–5 and A1 during 2017–2020. Partial sampling from six trees per year was conducted at sites 1 and 2 during 2017–2020 (from seven trees at site 2 in 2017) to sustain the monitoring trees. All the samples were obtained from the stems around breast height. During the partial sampling, bark pieces sized approximately 3 cm × 3 cm (axial length × tangential length) were collected from four directions of the tree stem using a chisel, and 12-mm-diameter wood cores were collected from two directions of the tree stem using an automatic increment borer (Smartborer, Seiwa Works, Tsukuba, Japan) equipped with a borer bit (10–101-1046, Haglöf Sweden, Långsele, Sweden). Such partial sampling increases the observational errors in the bark and wood 137Cs concentrations in individual trees26. To mitigate this error and maintain an accurate mean value of the 137Cs concentration, we increased the number of sampled trees from three to six. The sampling was conducted mainly in July–September of each year; the exceptions were site-5 samples in 2011 and 2012, which were collected irregularly during January–February of the following year. The collected bark pieces were separated into outer and inner barks, and the wood disks and cores were split into sapwood and heartwood. The outer and inner bark samples during 2012–2016 were obtained by partial sampling of barks sized approximately 10 cm × 10 cm from 2–3 directions on 2–3 trees per year.
The bulk samples of bark, sapwood, and heartwood were air-dried and then chipped into flakes using a cutting mill with a 6-mm mesh sieve (UPC-140, HORAI, Higashiosaka, Japan). The pieces of the outer and inner bark were chipped into approximately 5 mm × 5 mm pieces using pruning shears, and the cores of the sapwood and heartwood were chipped into semicircles of thickness 1–2 mm. Each sample was packed into a container for radioactivity measurements and its mass was measured after oven-drying at 75 °C for at least 48 h. Multiplying this mass by the conversion factor (0.98 for bark and 0.99 for wood)8 yielded the dry mass at 105 °C.
Radioactivity measurements
The radioactivity of 137Cs in the samples was determined by γ-ray spectrometry with a high-purity Ge semiconductor detector (GEM20, GEM40, or GWL-120, ORTEC, Oak Ridge, TN). For measurements, the bulk and partial samples were placed into Marinelli containers (2.0 L or 0.7 L) and cylindrical containers (100 mL or 5 mL), respectively. The peak efficiencies of the Marinelli containers, the 100-mL container, and the 5-mL container were calibrated using standard sources of MX033MR, MX033U8PP (Japan Radioisotope Association, Tokyo, Japan), and EG-ML (Eckert & Ziegler Isotope Products, Valencia, CA), respectively. For the measurement of the 5-mL container, a well-type Ge detector (GWL-120) was used under the empirical assumption that the difference in γ-ray self-absorption between the standard source and the samples is negligible27. The measurement was continued until the counting error became less than 5% (higher counting errors were allowed for small or weakly radioactive samples). The activity concentration of 137Cs in the bark (whole) collected by partial sampling was calculated as the mass-weighted mean of the concentrations in the outer and inner barks; meanwhile, the concentration in the wood (whole) was calculated as the cross-sectional-area-weighted mean of sapwood and heartwood concentrations. The activity concentrations were decay-corrected to September 1, 2020, to exclude the decrease due to the radioactive decay.
Discussion
Causes of temporal trends in bark 137Cs concentration
The 137Cs concentration in the whole bark decreased in many plots, clearly because the outer bark 137Cs concentration decreased. However, the whole bark 137Cs concentration showed a relatively small decrease or even a flat trend in some plots (site-2 cedar and site-1 cypress and oak). In the site-1 cypress plot, where the whole bark 137Cs concentration decreased relatively slowly, the inner bark 137Cs concentration notably increased. Similarly, although we lack early phase monitoring data in the site-2 cedar and site-1 oak plots, the inner bark 137Cs concentration in both plots is considered to have increased prior to monitoring because the sapwood 137Cs concentration increased in both plots and the CR of inner bark/sapwood was constant in all other plots. Therefore, the low-rate decrease or flat trend in the whole bark 137Cs concentration in some plots was probably caused by an increase in the inner bark 137Cs concentration, itself likely caused by high 137Cs root uptake (as discussed later).
The 137Cs concentration in the outer bark decreased in all four plots monitored since 2012 (site-1 and site-3 cedar, site-1 cypress, and site-3 pine), confirming the 137Cs drop/wash off from the bark surface. The constant (exponential) decrease in three of these plots indicates that the 137Cs drop/wash off was still continuing in 2020 but with smaller effect on the outer bark 137Cs concentration. In contrast, the decrease in the site-1 cypress plot seemed to slow down since around 2017. Furthermore, Kato et al.32 reported no decrease in 137Cs concentration in the outer bark of Japanese cedar during the 2012–2016 period. Such cases cannot be fitted by a simple decrease of the outer bark 137Cs concentration. As a longer-term perspective, in the outer bark of Norway spruces (Picea abies) affected by the Chernobyl nuclear accident, the biological half-life of 137Cs concentration was extended in areas with higher precipitation, suggesting that high root uptake of 137Cs hinders the decreasing trend33. The present study showed that 70–80% or more of the 137Cs deposited on the bark surface (outer bark) was removed by drop/wash off after 10 years from the accident and that the 137Cs CR of outer bark/inner bark became constant in some plots. These facts suggest that the longer-term variations in outer bark 137Cs concentration will be more influenced by 137Cs root uptake, although it is uncertain whether root uptake caused the slowing down of the decrease rate seen in the site-1 cypress plot. Further studies are needed to understand the 137Cs concentration in newly formed outer bark and to determine the 137Cs CR of outer bark/inner bark at steady state.
Causes of temporal trends in wood 137Cs concentration
The temporal trends of the 137Cs concentration in the whole wood basically corresponded to those in the sapwood. The exceptions were the site-3 and site-4 cedar plots, where the sapwood 137Cs concentration did not increase but the whole wood 137Cs concentration was raised by the notable increase in the heartwood 137Cs concentration. This behavior can be attributed to a species-specific characteristic of Japanese cedar, which facilitates Cs transfer from sapwood to heartwood8,15,34. The present study newly found that the increase in the 137Cs CR of heartwood/sapwood in the cedar plots became smaller or shifted to a flat trend around 2015–2016, indicating that 137Cs transfer between the sapwood and heartwood has reached apparent steady state at many sites 10 years after the accident. Therefore, after 2020, the whole wood 137Cs concentration in cedar is unlikely to increase without a concomitant increase in the sapwood 137Cs concentration.
The increasing trends in the 137Cs concentrations in whole wood and sapwood (site-2 cedar, site-1 cypress, and site-1 and site-3 oak plots) are seemingly caused by the yearly increase in 137Cs root uptake; however, the wood 137Cs concentration can also increase when the 137Cs root uptake is constant or even slightly decreases each year. This behavior can be shown in a simple simulation of the temporal variation in the wood 137Cs content (the amount of 137Cs in stem wood of a tree). If the 137Cs dynamics within a tree have reached steady state and the proportion of 137Cs allocated to stem wood become apparently constant, the wood 137Cs content in a given year can be considered to be determined by the amount of 137Cs root uptake and the amount of 137Cs emission via litterfall. The flat 137Cs CR trend of inner bark/sapwood during 2012–2020 (see Fig. 5) indicates that the 137Cs dynamics, at least those between the inner bark and sapwood, reached apparent steady state within 2011. Here we assume that (1) the annual amount of 137Cs root uptake is constant, (2) the proportion of 137Cs allocated to stem wood is apparently constant, and as assumed in many forest Cs dynamics models17,35,36,37, (3) a certain proportion of 137Cs in the stem wood is lost via litterfall each year. Under these conditions, the simulated amount of 137Cs emission balanced the amount of 137Cs root uptake after sufficient time, and the wood 137Cs content approached an asymptotic value calculated as [root uptake amount × allocation proportion × (1/emission proportion − 1)]. Note that the asymptotic value increases with increasing root uptake amount and decreasing emission proportion and does not depend on the amount of 137Cs foliar/bark surface uptake in the early post-accident phase. Nevertheless, the amount of 137Cs surface uptake in the early phase critically determines the trend of the wood 137Cs content. More specifically, the trend in the early phase will be increasing (decreasing) if the surface uptake is smaller (larger) than the asymptotic value. Finally, the temporal variation of the 137Cs concentration in wood is thought to be the sum of the dilution effect of the increasing wood biomass and the above-simulated variation in the wood 137Cs content. Therefore, in the early post-accident phase, the wood 137Cs concentration will increase when the wood 137Cs content increases at a higher rate than the wood biomass. As the wood 137Cs content approaches its asymptotic value (i.e., steady state), its increase rate slows and the dilution effect proportionally increases. Then, the wood 137Cs concentration shifts from an increasing trend to a decreasing trend. The trends of the 137Cs concentrations in whole wood and sapwood in the site-3 oak plot follow this basic temporal trend, which is similarly predicted by many simulation models9.
In other plots with the increasing trend (site-2 cedar and site-1 cypress and oak), the increase in the 137Cs concentrations in whole wood and sapwood became smaller or shifted to a flat trend around six years after the accident; however, it did not shift to a decreasing trend. This lack of any clear shift to a decreasing trend, which was similarly seen at sites with hydromorphic soils after the Chernobyl nuclear accident38,39, cannot be well explained by the above simulation. A core assumption of the simulation that the yearly amount of 137Cs root uptake is constant is probably violated in these plots, leading to underestimations of the root uptake amount. Although the inventory of exchangeable 137Cs in the organic soil layer has decreased yearly since the accident, that in the mineral soil layer at 0–5 cm depth has remained constant40. In addition, the downward migration of 137Cs has increased the 137Cs inventory in the mineral soil layer below 5-cm depth41,42. If the steady state 137Cs inventory of the root uptake source can be regarded as sufficient for trees, any increase in the 137Cs root uptake is likely explained by expansion of the root distribution and the increase in transpiration (water uptake) with tree growth. When the wood 137Cs content increases at a similar rate to the wood biomass, the increasing trend will not obviously shift to a decreasing trend. Therefore, assuming the 137Cs allocation and emission proportions in the mature trees do not change considerably with time, the amount of 137Cs root uptake is considered to be increasing yearly in these four plots.
In the remaining plots with the decreasing or flat trend (site-1 cedar, site-4 cedar without outliers, site-5 cypress, and site-3 pine), according to the above simulation, the amount of initial 137Cs surface uptake was larger than or similar to the asymptotic value, i.e. the amount of 137Cs root uptake is relatively small and/or the proportion of 137Cs emission via litterfall is relatively high. However, the amount of 137Cs root uptake in the plots with the flat trend is possibly increasing because the flat trend has not shifted to a decreasing trend. In these plots, although it is difficult to confirm apparent steady state of the soil–tree 137Cs cycling because of the lack of an initial increasing trend, the recent flat trends in the 137Cs CRs of heartwood/sapwood and inner bark/sapwood indicate that the 137Cs dynamics, at least within the trees, have reached apparent steady state.
Various factors were found to increase the 137Cs root uptake after the Chernobyl nuclear accident; for example, high soil water content, high soil organic and low clay content (i.e., low radiocesium interception potential [RIP]), low soil exchangeable K concentration, and high soil exchangeable NH4 concentration12,43. After the FDNPP accident, the 137Cs transfer from soil to Japanese cypress and konara oak was found to be negatively correlated with the soil exchangeable K concentration44,45 and the 137Cs mobility is reportedly high in soils with low RIP46. However, neither the soil exchangeable K and Cs concentrations nor the RIP have explained the different 137Cs aggregated transfer factors (defined as [137Cs activity concentration in a specified component/137Cs activity inventory in the soil]) of Japanese cedars at sites 1–446,47. Because the 137Cs dynamics within the forest and trees in many plots reached apparent steady state at 10 years after the FDNPP accident, the 137Cs aggregated transfer factor is now considered to be an informative indicator of the 137Cs root uptake. Therefore, a comprehensive analysis of the 137Cs aggregated transfer factor and the soil properties at more sites than in the present study will be important to understand key factors determining the amount of 137Cs root uptake by each tree species at each site.
Validity and limitation of the trend analyses
Although the application of the smooth local linear trend model failed in plots monitored for less than five years, it was deemed suitable for analyzing the decadal trend because it removes annual noises, which are probably caused by relatively large observational errors (including individual variability)26. Moreover, the algorithm that determines the trend and its shift between 2 and 4 delimiting years was apparently reasonable, because the detected trends well matched our intuition. However, when judging a trend, the algorithm simply assesses whether the true state values significantly differ between the delimiting years. Therefore, it cannot detect changes in the increase/decrease rate (i.e., whether an increasing/decreasing trend is approaching a flat trend). For example, the whole bark 137Cs concentration in the site-1 cypress plot was determined to decrease throughout the monitoring period. In fact, the decrease rate slowed around 2014 and the decreases were slight between 2014 and 2020 (see Fig. 2). Similarly, the sapwood 137Cs concentration in the site-1 cypress and oak plots was determined to increase throughout the monitoring period, but the increase rate has clearly slowed since around 2017. To more sensitively detect the shift from an increasing/decreasing trend to a flat trend, other algorithms are required. Nevertheless, this algorithm is acceptable for the chief aim of the present study; that is, to detect a trend shift from increasing to decreasing.
Conclusions
In many plots monitored at Fukushima and Ibaraki Prefectures, the 137Cs concentrations in the whole and outer bark decreased at almost the same yearly rate for 10 years after the FDNPP accident, indicating that the direct contamination of the outer bark was mostly but not completely removed during this period. Moreover, the 137Cs concentration in the whole bark decreased at relatively low rates or was stable in plots where the 137Cs root uptake was considered to be high. This fact suggests that indirect contamination through continuous root uptake can reach the same magnitude as direct contamination by the accident.
In all of our analyzed plots, the 137Cs CR of inner bark/sapwood has not changed since 2012, indicating that 137Cs transfer among the biologically active parts of the tree stem had already reached apparent steady state in 2011. In contrast, the 137Cs CR of heartwood/sapwood in six out of nine plots increased after the accident. In four of these plots, the 137Cs CR of heartwood/sapwood plateaued after 3–6 years; in the other two plots, the plateau was not reached even after 10 years. Therefore, saturation of 137Cs in heartwood (an inactive part of the tree stem) requires several years to more than one decade.
The 137Cs concentration in the whole wood showed an increasing trend in six out of nine plots. In four of these plots, the increasing trend shifted to a flat or decreasing trend, indicating that the 137Cs dynamics in many forests reached apparent steady state at 10 years after the accident. However, the lack of the clear shift to a decreasing trend indicates that the 137Cs root uptake is probably still increasing in some plots. Continuous monitoring surveys and further studies clarifying the complex mechanisms of 137Cs root uptake in forests are needed in order to refine the simulation models and improve their prediction accuracy.
Analysis of particles containing alpha-emitters in stagnant water at torus room of Fukushima Dai-ichi Nuclear Power Station’s Unit 2 reactor
May 16, 2022
Abstract
Particles containing alpha (α) nuclides were identified from sediment in stagnant water in the torus room of the Fukushima Dai-ichi Nuclear Power Station(FDiNPS)’s Unit 2 reactor. We analyzed uranium (U), which is the main component of nuclear fuel, using scanning electron microscopy (SEM). Other α-nuclides (plutonium [Pu], americium [Am], and curium [Cm]) were detected by alpha track detection and the morphology of particles with α-nuclides were analyzed by SEM-energy dispersive X-Ray (EDX) analysis. Several uranium-bearing particles ranging from sub-µm to several µm in size were identified by SEM observation. These particles contained zirconium (Zr) and other elements which constituted fuel cladding and structural materials. The 235U/238U isotope ratio in the solid fractions that included U particles was consistent with what was found for the nuclear fuel in the Unit 2 reactor. This indicated that the U of similar fuel composition had made finer. The α-nuclide-containing particles identified by alpha track analysis were several tens to several hundred µm in size. The EDX spectra showed that these particles mainly comprised iron (Fe). Since the amount of α-nuclide material was very small, Pu, Am, and Cm were adsorbed on the Fe particles. This study clarifies that the major morphologies of U and other α-nuclides in the sediment of stagnant water in the torus room of FDiNPS’s Unit 2 reactor differed.
Introduction
TEPCO’s Fukushima Dai-ichi Nuclear Power Station (FDiNPS) was severely damaged by the earthquake and resulting tsunami that struck on March 11, 20111. At the time, Units 1–3 of the six reactors were in operation, and the nuclear fuel in the Units 1–3 reactors was damaged. Seawater and freshwater were injected to remove the decay heat from the nuclear fuels. The water remained in the basement of the building, and the components of the nuclear fuel dissolved in it, resulting in highly radioactive stagnant water. The stagnant water contained radionuclides, such as fission products and actinides derived from nuclear fuels. A chemical treatment process was established to remove the radionuclides, and a recirculating engineering system was established to reuse the recovered cooling water. Since then, the amount of stagnant water has been gradually reduced, but it was discovered that the fine particles containing a higher concentration of Alpha (α)-emitting radionuclides were settling basement in the reactor building2. The concentrations of alpha-nuclides (102–105 Bq/L) in the stagnant water including sediments were higher than the cooling water in the downstream building. Alpha-emitting radionuclides such as uranium (U) and plutonium (Pu) can cause serious internal exposure upon entering the human body. Alpha-nuclides should be strictly controlled when compared to caesium(Cs)-137 and strontium(Sr)-90, which are the main nuclides in fission products. Technology must be developed to effectively remove the alpha-nuclides from the stagnant water. For this purpose, we collected stagnant water in the torus room in the basement of the reactor building of Unit 2 and conducted radiochemical analysis of the precipitates in the stagnant water.The stagnant water is a higher concentration compared with what was detected at the entrance to the Cs adsorption system. In addition, the presence of α-emitting radionuclides was confirmed in the samples containing mixed sludge components from the stagnant water in the reactor building. To proceed with the treatment of the stagnant water deep inside the reactor building in the future, a better understanding is required of the different types of α-emitters, particularly those included in particulate solids in the stagnant water.
In existing research, radioactive particles containing U were detected in association with Cs microparticles (CsMPs) outside the FDiNPS site and their physicochemical composition and morphology were analyzed3,4,5,6,7,8. Abe et al.3 collected CsMPs emitted from the FDiNPS from the atmosphere and analyzed them using synchrotron radiation X-rays to detect U in the CsMPs. Ochiai et al. detected U particles of several hundred nm in CsMPs by scanning electron microscopy-X-ray detection (SEM-EDX) analysis. Their results reflected the composition of UO2 on magnetite by observing the diffraction pattern obtained using transmission electron microscopy. Similarly, diffraction patterns of UO2 and zirconia were obtained from mixed particles of Zirconium (Zr) and U in CsMPs, respectively. This indicated that U was present in CsMPs in both UO2 nanocrystals and U-Zr nanocrystrals forms6. Kurihara et al.8 found that the U in the fuel composition of the Unit 2 reactor was present in the CsMPs by analyzing the isotope ratios of 235U and 238U in the CsMPs using nanoscale secondary ion mass spectrometry. The release of fuel-derived Pu into the environment has also been reported by soil analysis9,10,11,12,13, airborne particles14, and CsMPs7. For americium (Am) and curium (Cm), few reports have been published regarding their release into the environment11. Recently, Morishita et al.15 detected particles containing α-emitters in smear samples collected from inside the FDiNPS using an α-ray imaging detector. The maximum energy of the α-rays indicated the presence of 238Pu; γ-ray spectra indicated the presence of 241Am. The morphology of these α-emitters was not observed.
In this study, we analyzed the concentrations and forms of U and other α-emitters in liquid and solid phases to obtain the basic data necessary for considering a removal method for α-emitters in the stagnant water of Unit 2 of the FDiNPS. The search for radioactive particles in existing studies was conducted primarily using imaging plate (IP)4 or sodium iodide scintillation counters8,16 and by detecting γ-rays from CsMPs. However, while these methods are effective for CsMPs with high radioactivity, it is difficult to selectively detect α-emitters that are present in small amounts and with low specific radioactivity. Therefore, we decided to use a combination of an automated particle measurement method using SEM-EDX17 and a method for detecting particles containing α-emitters using solid-state track detectors18,19,20,21,22,23,24
Results and discussion
Particle size distribution of solids in the stagnant water containing uranium and alpha-emitters
Figure 1a shows a schematic of a sampling location of a stagnant water sample in this study. Figure 1b shows how the particles settled after the sample was collected. The reddish-brown particles had settled over time. The solids in the stagnant water were classified and the U concentration of each fraction was measured by inductively coupled plasma mass spectrometry. The results are shown in Table 1.


As indicated, 238U was quantified in all fractions of all particle sizes, indicating its existence in various particle sizes. More than 99 % of U was present in fractions larger than 10 μm. The 235U/238U isotopic ratio was approximately 1.9 %, which closely matched the Unit 2 composition (1.93 %)25. Analysis of the total α-activity in each fraction showed that more than 99.8 % of the α-emitters were present in fractions larger than 10 μm (see Supporting Information, Table S1). These results suggested that most of the U and α-emitters in the stagnant water sample of the Unit 2 were present in particle fractions larger than 10 μm. Accordingly, a search for particles containing U and α-emitters was attempted using particles in solid fractions.
Detection and composition analysis of uranium particles using scanning electron microscopy-X-ray detection
As the main U isotopes (235U and 238U) in the fuel composition have a long half-life and low specific activity, SEM-EDX was adopted to detect U-rich particles. Precipitates on the filter with a pore size of 5 μm were loaded onto carbon tape (Fig. 1c) and observed by SEM-EDX. Particles containing more than 3 % U by atomic ratio (hereafter referred to as “U particles”) were detected based on the results of elemental composition analysis. An example of the observation result of UP1 is shown in Fig. 2.

Black particle (UP1) was observed on top of the reddish-brown particles in the center of optical image in Fig. 2a. Figure 2b shows a backscattered electron detection(BED) image of the same region as Fig. 2a. In the BED image and its magnified view (Fig. 2b, c), the black particle in Fig. 2a had a high intensity. In general, a particle containing an element with a relatively higher atomic number yields a BED image with higher brightness. The particle (UP1) with high brightness in Fig. 2b, c should contain heavy element. The peaks at 3.18 keV (U Mα), 3.34 keV (U Mβ), and 3.55 keV (U Mγ)26 were observed within the EDX spectrum of the UP1 particle (Fig. 2d), indicating that the particle included U. According to the results of SEM-EDX composition analysis of the U particles (UP1 in Table S2), U was the main component. In addition, the distribution of components in the fuel-structure materials, such as Zr and Cr, was also observed on the U particle (Fig. 2e). In contrast, iron (Fe) was observed to have been distributed around the U particles, indicating that the U particles were attached to the Fe particles. These results suggested that the U particle would be particulate with fuel-structural materials.
Using the same procedure as in the above paragraph, 14 U particles were detected. The observed particle sizes and the elemental maps of U and Zr are shown in Fig. 3a. Elemental composition of U particles are shown in Table S2.

Uranium particles with size ranging from approximately 500 nm to 3 μm were observed. Uranium particles were attached to Fe particles or present on their own (Fig. S1). The content of Fe in the analyzed stagnant water sample was approximately 4,400 times higher compared with U, indicating that the main component of the filtered material was Fe. Uranium particles smaller than the filter pore diameter of 5 μm were trapped, suggesting that they were cake-filtered during centrifugal filtration.
The isotope ratios of U in this fraction were consistent with the fuel composition derived by ICP-MS measurements. The presence of U particles with an isotopic composition the same as the nuclear fuel suggested that these U in the stagnant water sample had been derived from reactor core. The release of U and Pu from the FDiNPS into the environment was investigated and clarified by analyzing bulk soil samples for Pu9,10,11,12,13 and measuring the isotopic composition of U3,6,9 and Pu particles7 associated with CsMPs. Fine U, U, and Zr particles, ranging in size from several tens of nm to several hundreds of nm, have been detected in association with CsMPs in the environment6. In the present study, it was found that particles approximately 10 times larger in size than the particles associated with CsMPs existed in the stagnant water sample. It was also clarified that some U particles were not associated with CsMPs but existed independently.
Many U particles included Zr, which would have been derived from cladding. The ratios of U and Zr in these particles are compared in Fig. 3b. The ratio of U to Zr in each particle varied. In addition, in some particles, Zr was not detected, suggesting that the particles retained their fuel form. An existing report6 suggested the existence of two types of U particles several hundred nm in size that had been derived from the FDiNPS and released into the environment; one of these particles was in the fuel form of UO2 and the other presented as a Zr mixed oxide.
Detection and analysis of particles containing alpha-emitters using alpha track detection
The distribution of α-emitters in solids was investigated using alpha track analysis. An example of α-emitter particles and observed alpha tracks is shown in Fig. 4a, b. The upper left part of the particle in Fig. 4a shows the presence of U particles UP10 and UP13 (Fig. 4c, d), which are identical to those shown in Fig. 3. The distribution of alpha tracks can be observed uniformly from the reddish-brown particles; the uneven distribution of the position of U particles is not presented. Only a few tens of alpha tracks were observed, even for the alpha tracks at the position of the UP1 particle (Fig. S2), which had the largest particle size among the detected U particles with a diameter of 3 μm (Fig. 3a). In comparison, several hundred alpha tracks can be observed in Fig. 4b. This result suggested that the main source of alpha tracks was not U particles but other α-emitters on the reddish-brown particles.

The particle with the most alpha tracks is shown in Fig. 5a, and the alpha tracks derived from this particle are shown in Fig. 5b. The SEM-EDX observation of this particle is shown in Fig. 5c. Three particles can be observed in this image, all of which were found to comprise mainly Fe, based on the elemental mapping results (Fig. 5d, e). Furthermore, the elemental analysis results showed that U and other α-emitters were not detected (Fig. 5d). An almost uniform distribution was observed of α-nuclides on the Fe particles; this indicated that the α-nuclides present in ionic form in the solution may have focused on the Fe particles.

Uranium was also detected in the fractions smaller than 10 μm; however, α-emitters were only detected in fractions larger than 10 μm (Table S1). As Fe particles were in much larger quantities and sizes than U, the most of Fe particles were present in fractions larger than 10 μm by cake-filtration. As a result, most of the α-emitters, such as Pu, Am, and Cm, were observed the fraction lager than 10 μm, although fine U particles were present in each fraction. Iron particles (Fig. 5) were approximately 100 μm in size, which were smaller than those in Fig. 4 (approximately 200 μm). The number of alpha tracks was much larger among the Fe particles in Fig. 5 than in Fig. 4. Thus, the amounts of α-nuclides were not proportional to the size of the Fe particles but varied between particles. As noted above, the contribution of U particles to the alpha tracks was minimal (Fig. S2), and the number of other α-emitters in U particles was negligible compared with the total amount of α-emitters.
Among the three particles, the IP1 particle, i.e., the main source of the alpha tracks, had been dissolved and α-ray measurements were performed. Figure 6 shows the α-ray spectra of the IP1. Alpha nuclides such as 239Pu, 240Pu, 241Am, and 244Cm were detected. For the particle analyzed in this study (IP1), the radioactivity ratio of 238Pu + 241Am to 239Pu + 240Pu was 4.03, and the ratio of 244Cm to 239Pu + 240Pu was 1.17, which was almost consistent with the fuel composition (4.50 and 1.14, respectively)25. Future work should clarify whether the variation of nuclides exists in each Fe particle.

Estimation of the chemical properties of uranium and alpha-emitter particles using micro-Raman spectroscopy
A Raman spectrum of the UP1 particle was obtained by micro-Raman spectroscopy. Figure 7a shows the Raman spectra obtained from the UP1 and uranium standard samples. The Raman peak of UP1 is located at approximately 730 cm−1, suggesting that it is in a different chemical state from UO2 and other U oxides. Figure 7b shows the Raman spectrum obtained from IP1. A Raman peak is only located at approximately 710 cm−1. Hanessh reported that natural ferrihydrite has only strong 710 cm−1 band27.The Raman spectrum of IP1 showed that the surface of the Fe particles existed as ferrihydrite. Since the pH of the stagnant water sample was almost neutral and the adsorption of Pu28,29 and Am29 on Fe oxides was previously reported, the ions or colloids of these α-emitters would be adsorbed onto the Fe particles. Accordingly, it is suggested that α-nuclides are distributed on Fe oxides.
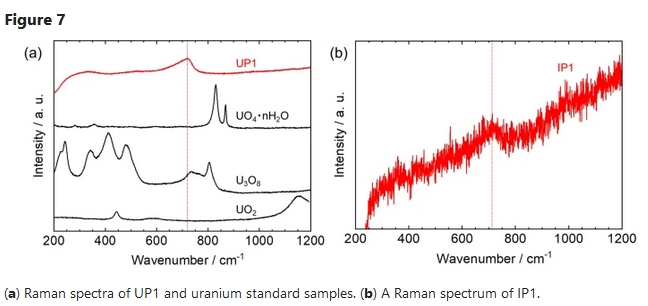
Conclusion
To eliminate the presence of α-emitters in the stagnant water, the particles were collected according to their size. Uranium particles were detected by SEM-EDX. Other α-emitters (Pu, Am, and Cm) were detected using alpha track detection and measured via alpha spectrometry. The average isotopic composition of U in the stagnant water sample match well with the fuel composition of FDiNPS’s Unit 2. The U particles in this sample were up to 10 times larger in size than those observed in the environment. It was also shown that Pu, Am, and Cm α-emitters were adsorbed onto Fe particles. These results demonstrated that the major morphology of U and other α-emitters was different. By understanding these types of α-emitters, important information was obtained for considering the separation method of α-emitters in the treatment of the stagnant water in the Unit 2.
Methods
Sampling of stagnant water in the torus room of FDiNPS’s Unit 2
A 40-mL of stagnant water sample in torus room of FDiNPS’s Unit 2 was provided form TEPCO HD. The stagnant water containing sediment accumulated on the basement floor was collected with a water sampler at 30th June, 2020.
Classification of solids and the distribution of uranium and alpha nuclides in the stagnant water
A 2-mL sample of the stagnant water was collected with a stirring well and transferred to a centrifugal ultra-holder (UHP-13C; Advantec) equipped with a 10 µm pore-size membrane filter (PTFE, o.d.13 mm; Merck). This centrifugal ultra-holder was set in a centrifugal separator (CN-820; Az-one) and centrifuged at a rotation speed of 3000 rpm for 10 min to separate the residue from the filtrate. The filtrate was sequentially filtered through 1, 0.1, and 0.02 µm filters. To dissolve the α-emitters in the residue and filtrate, each sample was transferred to a quartz beaker. Nitric acid (HNO3) and hydrogen peroxide (H2O2) solutions were added to the residue and the filtrate on the filter to create a 2 M HNO3–2% H2O2 solution, which was heated and dissolved on a hotplate at 130 °C for 1 h. Since the 0.02 µm pore size of the Anopore membrane filter (0.02 µm pore size; Whatman) was dissolved by HNO3 and the impure U contained by the filter was eluted, determination of the residue in the 0.02-µm section was derived from the difference in U concentration in the filtrate of the 0.1 and 0.02 µm filters. The heated sample solution was passed through a UTEVA-Resin column (UT-C20-A; Eichrom) conditioned with 6 mL of 2 M HNO3; 15 mL of 2 M HNO3 was used to wash out impurities in the column, and 10 mL of 0.01 M HNO3 was passed through to elute U adsorbed in the column. The collected eluate was heated on a hotplate at 130 °C until just before it dried up and then re-dissolved in 5 mL of 0.32 M HNO3 to make the solution for the ICP-MS measurement. Quantitative analyses of 235U and 238U were performed by ICP-MS (7700x ICP-MS; Agilent) in the “no-gas” mode using the calibration curve method with a natural U solution. The same procedure was repeated two times (sample name: SW-1,-2).
Detection of particles containing alpha-emitters using a solid-state nuclear detector
A 1 mL sample of stagnant water was taken and particles were collected by centrifugal filtration using a filter with a pore size of 5 µm (Millipore). Some of the collected particles were transferred to a carbon tape attached to an aluminum sample table using micro spatulas. The sample was placed on top of a solid-state track detector (TNF-1; Hartzlas) and exposed to alpha-rays from the sample for 19 h. Following the exposure, the detector was etched with a 7 M sodium hydroxide solution at 70 °C for 3 h. After the etching process, the detector was ultrasonically cleaned three times using ultrapure water and dried with a clean wipe. The alpha tracks created on the solid-state track detector were observed using an optical microscope (VHX-5000; Keyence), and the location of the particles with high concentrations of α-emitters was identified. The identified α-rich particles were analyzed to observe their composition using SEM-EDX (JEOL, JCM-7000).
Each of the three particles in the spot where the largest number of alpha tracks were observed was transferred onto a 5 mm square silicon (Si) chip using a micromanipulator (QP-3RH; MicroSupport). The micromanipulator was attached to a sampling tool (MTW-1; MicroSupport) and set with micro tweezers (TW-2525; MicroSupport). Under observation using a ×100 to ×1000 objective lens (VH-Z1000R; Keyence) in a microscope, the microparticles were separated using the micro tweezers and placed on the Si chip. The Si chip loaded with the microparticles was transferred to a quartz beaker using ceramic tweezers (TA-CK-20; Toray). Then, 2 mL of 2M HNO3 + 2% H2O2 was added to the beaker and heated on a hotplate at 150 °C for 1 h to dissolve the microparticles, then it was heated on a hotplate at 180 °C for approximately 1 h. Next, The Si chip was cleaned while removing it from the quartz beaker using 5 mL of 0.5 M HNO3. The mixture of sample and the rinsing solution was re-dried on a hotplate at 180 °C for approximately 1 h and 30 min. Next, 2 mL of 0.5 M HNO3 was added and the sample was heated on a hotplate at 180 °C for approximately 30 min. When the sample solution was approximately 0.1 mL, it was removed from the hotplate. The sample preparation was performed by heating a sample holder for α-ray measurement (o.d.20 mm, stainless steel) at 100 °C, then dropping the sample solution to spread it in the center and baking it on the sample holder.
Detection and analysis of uranium-containing particles using scanning electron microscopy with energy dispersive X-ray analysis
The same sample that had been used to complete alpha track analysis was used for U-containing particles larger than 0.5 µm in diameter using the automatic particle finder17 of the SEM-EDX. First, the field of view was fixed by observing the back-scattered electron image of part of the sample for observation at a magnification of ×1500. Then, in the field of view, the lower limit of brightness was set so that heavy elements beyond Zr could be detected; heavy element particles were automatically detected. The detected particles were automatically elementally analyzed and identified as particles containing more than 3% U by atomic ratio, based on the results of elemental composition analysis. For each U particle detected by the automated particle finder, EDX mapping analysis was performed to determine the elemental composition of U particles. The U and Zr ratios were calculated from the intensity of the 3.18 keV (U Mα) and 2.04 keV (Zr Lα) lines, which were obtained from the EDX spectra of the U particles.
Microscopic Raman spectroscopic analysis of uranium particles and alpha-emitter particles
The micro-Raman spectrometer (Micro-RAM 532A; Lambda Vision Inc., Japan) used in this study was equipped with a 532-nm neodymium-doped yttrium aluminum garnet laser and a Raman charge-coupled device detector. The laser was focused onto the sample using a ×100 magnification objective lens. The laser power at the sample position was measured using an optical power meter (3664; Hioki Inc., Japan). In this study, the laser power at the sample position was adjusted to 0.4 mW for the measurement of U particles. The acquisition times measured 60 s. Each spectrum made of five accumulations was acquired for each particle. For the measurement of each standard U particle, the laser power at the sample position was adjusted to 0.03 mW. The acquisition times measured 60 s. Each spectrum made of ten accumulations was acquired for each uranium particles. For the measurement of α-emitter particles, the laser power at the sample position was adjusted to 0.1 mW. The acquisition times measured 10 s. Each spectrum made of five times was acquired.
Data availability
The data that support the findings of this study are available from Tokyo Electric Power Company Holdings Inc. but restrictions apply to the availability of these data, which were used under license for the current study, and so are not publicly available. Data are however available from the authors upon reasonable request and with permission of TEPCO HD.
To read more: https://www.nature.com/articles/s41598-022-11334-1
How Close Is Fukushima Nuclear Accident Contaminated Water to Us?
Macroscopic and microscopic simulations of Fukushima nuclear accident contaminated water discharge.
On August26, 2021, the Japanese Cabinet passed a bill to discharge treated Fukushima nuclear accident contaminated water into the Pacific Ocean to alleviate the problem of nuclear wastewater storage. However, large amounts of radionuclides can affect marine biological chains when inhaled by marine life and adversely influence marine fisheries and human health. The global effects of Fukushima discharge, which will last 30-40 years, remain unknown. Thus, identifying the diffusion process of radioactive water in oceans is critical.
To solve this problem, a team from Tsinghua University, China, developed analysis models from both macroscopic and microscopic perspectives, to simulate the diffusing process of the nuclear elements. The former one focuses on the overall distribution of pollutants, while the latter focuses on the behavior of individual pollutants.
Macro simulation results (Figure b) revealed that in the early stages of pollutant discharge, the polluted area increases rapidly, reaching 30° of latitude × 40° of longitude within 120 days. Due to ocean currents, the pollutant diffusion speed is considerably higher in the latitude direction than that in the longitude direction.
In 1200 days, the pollutants will cover almost the whole North Pacific region, reaching as far as the coast of North America to the east, and the Australia to the south. The pollutants will then spread rapidly to the South Pacific Ocean, under the influence of the equatorial current along the Panama Canal. The Indian Ocean will also be influenced, due to the waters infilling from north of Australia, in 2400 days. On day 3600, the pollutants will cover almost the entire Pacific Ocean.
Notably, although the contaminated water is discharged near the Japanese island, the contamination center (represented by yellow and red in Fig. b and c) will over time move eastward along the 35°N latitude line.
The team plotted the pollutant concentrations in adjacent waters of Miyazaki, Shanghai, and San Diego, all near 30°N, as shown in Figure d. Miyazaki gets polluted first, followed by Shanghai and San Diego, in order of their distances from Fukushima. According to the trend of the three curves, the pollutant concentration in each region increases rapidly at the beginning before stabilization. Although San Diego is the last city among the three to be affected, the steady-state concentration of pollutants in its adjacent waters is even higher than that near Miyazaki.
The differences in pollutant concentrations near Miyazaki, Shanghai, and San Diego result from the strong ocean current near Japan. Specifically, Fukushima is located at the confluence of Kuroshio (northward) and Oyashio (southward). Therefore, most pollutants do not migrate towards north and south along the land edges but spread eastward with the North Pacific west wind drift. In the early stage of treated water discharge, its impact on coastal Asia should be focused on. However, at a subsequent stage, the high concentration of nuclear elements near North America will definitely become a concern.
Reference: “Discharge of treated Fukushima nuclear accident contaminated water: macroscopic and microscopic simulations” by Yi Liu, Xue-Qing Guo, Sun-Wei Li, Jian-Min Zhang and Zhen-Zhong Hu 2021, 26 November 2021, National Science Review.
DOI: 10.1093/nsr/nwab209
Fukushima Nuclear Accident Discharge: Animation of Macroscopic Diffusion Analysis
2 déc. 2021
The increase in tritium concentration caused by Fukushima discharge over a decade. Credit: ©Science China Press
Study: Fukushima discharge to affect entire Pacific Ocean in 10 years

03-Dec-2021
Chinese scientists have mapped out the potential global effects of Fukushima discharge, suggesting that the contaminated water, if poured forth, may sprawl onto the entire Pacific Ocean within 10 years.
The study, published online in the peer-reviewed journal National Science Review, showed that 3,600 days after discharge, the pollutants will have covered almost the entire Pacific Ocean.
The Japanese government announced in April that it would start dumping contaminated water from around the spring of 2023.
The researchers from China’s Tsinghua University led by Zhang Jianmin and Hu Zhenzhong simulated the diffusing process of nuclear elements and found that the pollutants could affect China’s coast 240 days after discharge.
The polluted water would spread to almost the entire North Pacific region within 1,200 days, before spreading southward to the South Pacific Ocean and the Indian Ocean, according to the study.
The nuclear elements would eventually cause concern near North America, noticeably polluting the West coast of the United States after 2,400 days, it found.
China has expressed serious concerns about Japan’s decision to discharge contaminated water from the Fukushima nuclear station, calling for an open, transparent and responsible approach to prudently deal with its disposal.
Tracking contaminated water from the Fukushima nuclear accident
December 2, 2021
In a paper published in the National Science Review, a team from Tsinghua University analyzed the diffusion process of the treated Fukushima accident contaminated water to be discharged into the Pacific Ocean from 2023. Results show that the tritium, the main pollutant in the radioactive water, will spread to the whole North Pacific in 1200 days, which is important to formulate global coping strategies.
On 26 August 2021, the Japanese Cabinet passed a bill to discharge the treated water into the Pacific Ocean to alleviate the problem of nuclear wastewater storage. However, large amounts of radionuclides can affect marine biological chains and adversely influence marine fisheries and human health. The global effects of Fukushima discharge, which will last 30 to 40 years, remain unknown. Thus, identifying the diffusion process of radioactive water in oceans is critical.
To solve this problem, a team from Tsinghua University, China, developed analysis models from both macroscopic and microscopic perspectives, to simulate the diffusing process of the nuclear elements. The first focuses on the overall distribution of pollutant, while the second focuses on the behavior of the individual pollutant. Macro simulation results (Figure b) revealed that in the early stages of pollutant discharge, the polluted area increases rapidly, reaching 30 degrees of latitude × 40 degrees of longitude within 120 days. Due to ocean currents, the pollutant diffusion speed is considerably higher in the latitude direction than that in the longitude direction.
In 1200 days, the pollutants will cover almost the whole North Pacific region, reaching as far as the coast of North America to the east, and the Australia to the south. The pollutants will then spread rapidly to the South Pacific Ocean, under the influence of the equatorial current along the Panama Canal. The Indian Ocean will also be influenced, due to waters infilling from north of Australia, in 2400 days. On day 3600, the pollutants will cover almost the entire Pacific Ocean. Notably, although the contaminated water is discharged near the Japanese island, the contamination center (represented by yellow and red in Fig. b and c) will over time move eastward along the 35 degrees N latitude line.
The team plotted the pollutant concentrations in adjacent waters of Miyazaki, Shanghai and San Diego, all near 30 degrees N, as shown in Figure d. Miyazaki is polluted first, followed by Shanghai and San Diego, in order of their distances from Fukushima. According to the trend of the three curves, the pollutant concentration in each region increases rapidly at the beginning before stabilization. Although San Diego is the last city among the three to be affected, the steady-state concentration of pollutants in its adjacent waters is even higher than that near Miyazaki.
The differences in pollutant concentrations near Miyazaki, Shanghai and San Diego result from the strong ocean current near Japan. Specifically, Fukushima is located at the confluence of Kuroshio (northward) and Oyashio (southward). Therefore, most pollutants do not migrate towards north and south along the land edges but spread eastward with the North Pacific west wind drift. In the early stage of treated water discharge, its impact on the coastal Asia should be focused. However, at a subsequent stage, the high concentration of nuclear elements near North America will definitely become a concern.
More information: Yi Liu et al, Discharge of treated Fukushima nuclear accident contaminated water: macroscopic and microscopic simulations, National Science Review (2021). DOI: 10.1093/nsr/nwab209
https://phys.org/news/2021-12-tracking-contaminated-fukushima-nuclear-accident.html
Particulate plutonium released from the Fukushima Daiichi meltdowns
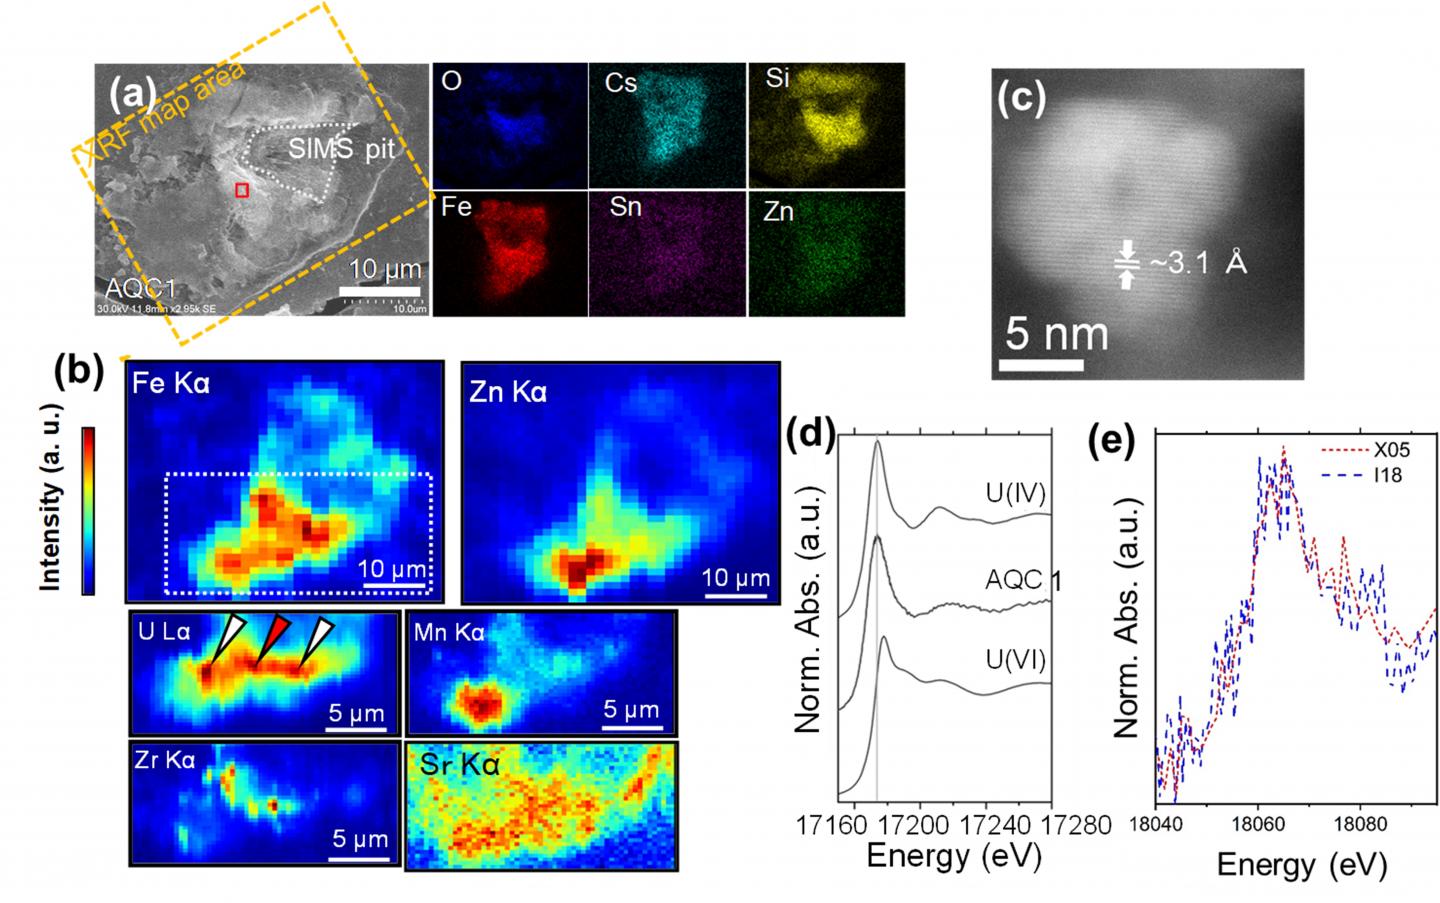
High levels of radioactive material migrating down into soil around Fukushima

High levels of radioactive cesium remain in the soil near the Fukushima Daiichi nuclear power plant and these radionuclides have migrated at least 5 centimeters down into the ground at several areas since the nuclear accident five years ago, according to preliminary results of a massive sampling project being presented at the JpGU-AGU joint meeting in Chiba, Japan.
In 2016, a team of more than 170 researchers from the Japanese Geoscience Union and the Japan Society of Nuclear and Radiochemical Sciences conducted a large-scale soil sampling project to determine the contamination status and transition process of radioactive cesium five years after a major earthquake and tsunami caused a nuclear accident at the Fukushima Daiichi plant.
The team collected soil samples at 105 locations up to 40 kilometers (25 miles) northwest of the Fukushima Daiichi nuclear power plant in the “difficult-to-return” zone where entry is prohibited. The project seeks to understand the chemical and physical forms of radionuclides in the soil and their horizontal and vertical distribution.
The Japanese government has monitored the state of radioactive contamination in the area near the plant since the 2011 accident by measuring the air dose rate, but scientists can only determine the actual state of contamination in the soil and its chemical and physical forms by direct soil sampling, said Kazuyuki Kita, a professor at Ibaraki University in Japan, who is one of the leaders of the soil sampling effort.
Understanding the radionuclides’ chemical and physical forms helps scientists understand how long they could stay in the soil and the risk they pose to humans, plants and animals, Kita said. The new information could help in assessing the long-term risk of the radionuclides in the soil, and inform decontamination efforts in heavily contaminated areas, according to Kita, one of several researchers will present the team’s preliminary results at the JpGU-AGU joint meeting next week.
Preliminary results show high levels radioactive cesium are still present in the soil near the plant. The levels of radiation are more than 90 percent, on average, of what was found immediately following the accident, according to Kita.
Most of the radiocesium in the soil was found near the surface, down to about 2 centimeters, immediately following the 2011 accident. Five years later, at several sampling points, one-third to one-half of the radiocesium has migrated deeper into the soil, according to Kita. Preliminary results show the radiocesium moved about 0.3 centimeters per year, on average, deeper into the soil and soil samples show the radiocesium has penetrated at least 5 centimeters into the ground at several areas, according to Kita.
The team plans to analyze samples taken at greater depths to see if the radiocesium has migrated even further, he said.
“Most of the radioactive cesium remains after five years, but some parts of the radioactive cesium went from the surface to deeper soil,” he said.
Knowing how much radioactive contamination has stayed on the surface and how deep it has penetrated into the soil helps estimate the risk of the contaminants and determine how much soil should be removed for decontamination. The preliminary results suggest decontamination efforts should remove at least the top 6 to 8 centimeters of soil, Kita said.
The preliminary data also show there are insoluble particles with very high levels of radioactivity on the surface of the soil. Debris from the explosion fused with radiocesium to form small glass particles a few microns to 100 microns in diameter that remain on the ground, according to Kita. The team is currently trying to determine how many of these radiocesium glass particles exist in areas near the nuclear plant, he said.
“We are afraid that if such high radioactive balls remain on the surface, that could be a risk for the environment,” Kita said. “If the radioactivity goes deep into the soil, the risk for people in the area decreases but we are afraid the high radioactive balls remain on the surface.”
— Nanci Bompey is the manager of AGU’s public information office. This research is being presented Thursday, May 25 at the JpGU-AGU joint meeting in Chiba, Japan.
Testimony from Disaster
MINES Paris Tech is the leading institution, at the heart of the french nuclear lobby, a state within the State.
Crisis management students in France are hoping to learn from a first-hand account of the Fukushima nuclear disaster.
Franck Guarnieri, a researcher in risk and crisis management at one of France’s leading institutions, MINES ParisTech, has been studying the accident.
Guarnieri and his team have interviewed nearly 30 government officials, experts, and employees at Tokyo Electric Power Company who were active during the aftermath of the 2011 disaster.
He is particularly interested in the actions of the late Masao Yoshida, the plant manager at the time.
Some months after the disaster, Yoshida told the government about what he did. The transcript, titled the Yoshida Testimony, was released in 2014.
When Guarnieri saw it, he decided to publish it in French.
The job of rendering Yoshida’s entire 28-hour testimony into French was recently completed. The translation takes up 3 volumes, 2 of which are now in print.
“This is the first time the testimony of a plant manager has been made public. In the Three Mile Island and Chernobyl accidents, the plant managers did not give testimonies,” says Guarnieri.
Rather than simply focusing on the events and facts of the disaster, Guarnieri and his team are especially interested in Yoshida’s emotional and psychological state, as the person in charge of the accident response.
These are some of his statements:
“There was no manual for this situation. To put it bluntly, I realized I’d have to rely on my intuition and judgment.”
“If we had stopped injecting water into the reactors it would have been catastrophic, so I decided to continue.”
Guarnieri’s team says those words indicate that Yoshida had to make decisions based on information that was potentially incorrect. They say the Yoshida Testimony is quite different from other official accounts, which tend to include little regarding the human element.
France now operates more than 50 nuclear power plants, which supply 70% of the nation’s electricity. To date, there haven’t been any major nuclear accidents.
But Guarnieri believes the officials at these French nuclear power plants need to read Yoshida’s testimony.
Recently, he met with Jean-Marc Cavedon, the director of the French Alternative Energies and Atomic Energy Commission on the outskirts of Paris.
Guarnieri stressed the unique importance of the Yoshida document, and urged them to devise safety measures for extreme situations.
“There will be no progress in risk management unless we learn from other people’s experience and improve as human beings,” says Cavedon.
“Nuclear power plants need to improve their risk management, by facing up to the disastrous events in Fukushima,” says Guarnieri.
Two years after the nuclear accident, Yoshida died of cancer.
Guarnieri is now intent on spreading the lessons of Yoshida’s testimony, to make sure such a tragedy never happens again.
https://www3.nhk.or.jp/nhkworld/en/news/editors/5/20170403/

Study: S. Korean nuclear disaster would hit Japan the hardest

The projected spread of radioactive cesium-137 from a disaster at the No. 3 reactor’s spent fuel pool of the Kori nuclear plant in Busan, South Korea (Provided by Kang Jung-min)
A serious nuclear accident in South Korea could force the evacuation of more than 28 million people in Japan, compared with around 24 million in the home country of the disaster.
Japan would also be hit harder by radioactive fallout than South Korea in such a disaster, particularly if it occurred in winter, when strong westerly winds would blow radioactive substances across the Sea of Japan, according to a simulation by the Natural Resources Defense Council, a Washington-based think tank.
The simulation, based on a scenario of an unfolding crisis at the Kori nuclear power plant in Busan, South Korea, was led by Kang Jung-min, a South Korean senior researcher of nuclear physics, and his colleagues.
At events in Japan and South Korea, Kang, 51, has repeatedly warned about East Asia’s vulnerability to a severe nuclear accident, saying the region shares the “same destiny” regardless of the location of such a disaster.
The Kori nuclear complex is home to seven of the country’s 25 commercial reactors, making it one of the largest in South Korea. Its oldest reactor–and the first in the country–went online in 1978.
Spent nuclear fuel at the Kori plant is cooled in on-site storage pools next to reactors.
But the operator of the plant has ended up storing spent fuel in more cramped conditions than in the past because waste keeps accumulating from the many years of operations.
An estimated 818 tons of spent fuel was being stored at the pool of the Kori No. 3 reactor as of the end of 2015, the most at any reactor in the country.
That is because the No. 3 pool has also been holding spent fuel from the No. 1 and No. 2 reactors since their fuel pools became too crowded.
Storing spent fuel in such a manner greatly increases the risk of a nuclear accident, Kang warned.
Kang’s team simulated the series of likely events that would follow if the No. 3 reactor lost power in a natural disaster or an act of terrorism.
With no power, the spent fuel at the No. 3 reactor could not be cooled. The cooling water would evaporate, exposing the fuel rods to air, generating intensive heat and causing a fire.
Hydrogen gas would then fill up the fuel storage building, leading to an explosion that would result in the release of a large amount of vaporized cesium-137 from the spent fuel.
Assuming that the catastrophe occurred on Jan. 1, 2015, the researchers determined how highly radioactive cesium-137 would spread and fall to the ground based on the actual weather conditions over the following week, as well as the direction and velocity of winds.
To gauge the size of the area and population that would be forced to evacuate in such a disaster, the team took into account recommendations by the International Commission on Radiological Protection, a private entity, and other organizations.
The results showed that up to 67,000 square kilometers of land in Japan–or much of the western part of the country–would fall under the evacuation zone, displacing a maximum of 28.3 million people.
In South Korea, up to 54,000 square kilometers would need to be vacated, affecting up to 24.3 million people.
The simulation also found that 18.4 million Japanese and 19 million Koreans would remain displaced for even after 30 years, the half-life of cesium-137, in a worst-case scenario.
Radioactive materials from South Korea would also pollute North Korea and China, according to the study.
Nineteen reactors in South Korea are located in the coastal area facing the Sea of Japan, including those at the Kori nuclear power plant.
Kang said the public should be alerted to the dangers of highly toxic spent fuel, an inevitable byproduct of nuclear power generation.
One ton of spent fuel contains 100,000 curies of cesium-137, meaning that 20 tons of spent fuel would be enough to match the estimated 2 million curies of cesium-137 released in the 1986 Chernobyl disaster.
An average-size light-water reactor produces about 20 tons of spent fuel in one year of operation.
East Asia is home to one of the world’s largest congestions of nuclear facilities, Kang said.
Japan, China and South Korea, which have all promoted nuclear energy as state policy for decades, together host about 100 commercial reactors.
A number of nuclear-related facilities are also concentrated in North Korea, particularly in Yongbyon, north of Pyongyang.
If a severe accident were to occur in China, the pollution would inevitably spill over to South Korea and then to Japan.
“That is why people should take serious interest in not just their own country’s nuclear issues, but also in neighboring countries,” Kang said. “Japan, China and South Korea should cooperate with each other to ensure the safety and security of spent fuel and nuclear facilities.”
He said the risks of a fire would be reduced if spent fuel were placed at greater intervals in storage pools.
“Ideally, spent fuel should be moved to sealed dry casks and cooled with air after it is cooled in a pool for about five years,” he said.
Cows in Fukushima Radiation Zone Find New Purpose: Science

NAMIE, Japan — In an abandoned Japanese village, cows grazing in lush green plains begin to gather when they hear the familiar rumble of the ranch owner’s mini-pickup. This isn’t feeding time, though.
Instead, the animals are about to be measured for how they’re affected by living in radiation — radioactivity that is 15 times the safe benchmark. For these cows’ pasture sits near Fukushima, a name now synonymous with nuclear disaster.
The area was once a haven for agriculture with more than 3,500 cattle and other livestock. Ranchers who refused a government order to kill their cows continue to feed and tend about 200 of them. The herds won’t be used as food; now science is their mission.
Researchers visit every three months to test livestock living within a 20-kilometer (12-mile) radius of the Fukushima plant, where three reactors had core meltdowns after the facility was swamped by a tsunami in 2011. It is the first-ever study of the impact on large mammals of extended exposure to low-level radiation.
The ranchers are breeders, as opposed to those raising cattle to sell for beef, and tend to be attached to their animals. They treat them almost as if they were children, even giving them names. The research gives them a reason to keep their beloved cows alive, and to hope that someday ranching might safely return here.
Under a drizzling rain, doctors and volunteers wearing blue Tyvek protective suits draw the cows into a handmade pen of aluminum pipes. Five to six cows line up in the cage and are tied with a rope around their head and through their nose ring for solid support, so they won’t be hurt when the needle draws blood from their neck.
The gentle beasts moo from discomfort. The doctors work swiftly, drawing blood, collecting urine and checking for lumps or swollen lymph nodes. The check-up takes five minutes or less per cow.
Namie, 11 kilometers (7 miles) northwest of the plant, is a ghost town with no prospect of being habitable for years. But 57-year-old Fumikazu Watanabe comes every day to a ranch to feed 30 to 40 cows owned by seven farmers.
“What is the meaning of slaughtering the cows?” Watanabe said at a worn-out barn where healthy cows used to spend the night tending to their calves. The bones of animals that have died litter the ground outside.
“Keeping the cows alive for research purposes means that we can pass on the study to our next generation instead of simply leaving a negative legacy,” he said.
The research team, made up of veterinary and radiation experts from Iwate University, Tokai University and Kitasato University, was established a year after the meltdowns. They formed a nonprofit group called Society for Animal Refugee & Environment post Nuclear Disaster. Members volunteer to take the blood and urine samples and test them.
In 2012, the Japanese government ordered all livestock in the restricted area killed for fear that the breeding cows would continue to reproduce, and that cows exposed to radiation would have no sale value.
Keiji Okada, associate professor of veterinary medicine and agriculture at Iwate University, said the government considered it pointless to study the animals, since it couldn’t determine how much radiation they were exposed to immediately after the disaster.
Okada disagrees. He said the data will help researchers learn whether farmers can eventually work in affected zones.
“There are no precedent studies of animals being exposed to low-dose radiation, and we have no idea what results we are going to get,” he said. “That is exactly why it needs to be monitored.”
So far, the animals’ internal organs and reproductive functions have shown no significant abnormality particularly linked to radiation exposure, Okada said, but it’s too early to draw conclusions about thyroid cancer and leukemia.
Radiation could cause leukemia, but so could mosquitoes, which have infected cattle around the world with bovine leukemia virus.
“Even if we detect leukemia in the cows, we don’t know whether it’s caused by radiation or if it’s a bovine leukemia from a virus,” Okada said. “It is this year’s objective to be able to differentiate the two.”
Many cows have died during the study period, but food shortages have played a role, making it all the more difficult the doctors to determine causes. The dead cows are dissected and the radiation dosage in their organs is measured.
Is radiation killing the cows, or making them sick? Okada said the research team is working toward reaching a conclusion by March. The team worries that the study results could spark overly broad fears that the region will no longer be habitable or fit for agriculture.
Ultimately, Okada said, the team believes that further monitoring of the animals will show under what conditions it is safe to raise livestock exposed to low-level radiation, and how best to deal with such a leak should it happen again.
Yukio Yamamoto, owner of the large Yamamoto Ranch surrounded by a mountain, a river and a vast plain, travels three hours roundtrip from his temporary home to feed his remaining cows.
Yamamoto initially followed government orders to kill his cattle. He watched a mother cow being killed while a calf was still suckling on its milk, and then the calf following that.
“The cows are my family. How do I dare kill them?” Yamamoto said. “If there is a God, I’m sure some day we would be rewarded for the sacrifice we are making.”
He hopes one day to see his barn come to life again, filled with a hundred cows and calves cared for by his children and grandchildren.
http://www.nytimes.com/aponline/2016/09/22/world/asia/ap-as-japan-fukushima-cows.html?_r=0
1 This Month

of the week – Nuclear Information and Resource Service
July 16 – 19H BST ATOMIC TIES Webinar!!


22,000+ miles voyaging for nuclear disarmament
and a radiation-free environment https://vfpgoldenruleproject.org/
To see nuclear-related stories in greater depth and intensity – go to https://nuclearinformation.wordpress.com
-
Archives
- July 2026 (125)
- June 2026 (287)
- May 2026 (306)
- April 2026 (356)
- March 2026 (251)
- February 2026 (267)
- January 2026 (308)
- December 2025 (358)
- November 2025 (359)
- October 2025 (376)
- September 2025 (257)
- August 2025 (319)
-
Categories
- 1
- 1 NUCLEAR ISSUES
- business and costs
- climate change
- culture and arts
- ENERGY
- environment
- health
- history
- indigenous issues
- Legal
- marketing of nuclear
- media
- opposition to nuclear
- PERSONAL STORIES
- politics
- politics international
- Religion and ethics
- safety
- secrets,lies and civil liberties
- spinbuster
- technology
- Uranium
- wastes
- weapons and war
- Women
- 2 WORLD
- ACTION
- AFRICA
- Atrocities
- AUSTRALIA
- Christina's notes
- Christina's themes
- culture and arts
- Events
- Fuk 2022
- Fuk 2023
- Fukushima 2017
- Fukushima 2018
- fukushima 2019
- Fukushima 2020
- Fukushima 2021
- general
- global warming
- Humour (God we need it)
- Nuclear
- RARE EARTHS
- Reference
- resources – print
- Resources -audiovicual
- Weekly Newsletter
- World
- World Nuclear
- YouTube
-
RSS
Entries RSS
Comments RSS
