The future of all life: Indigenous sovereignty and the Fukushima nuclear disaster, Bay View, National Black Newspaper,by Harun Minhaj, March 4, 2019 In 2011, an unprecedented series of die-offs began to strike dead hundreds of millions of sea creatures in the northern Pacific Ocean. As one sailor who frequently travels the Pacific remarked in October of 2013:
“I’ve done a lot of miles on the ocean in my life and I’m used to seeing turtles, dolphins, sharks and big flurries of feeding birds. But this time, for 3,000 nautical miles, there was nothing alive to be seen.”
What precipitated such a dramatic devastation of marine life in the Pacific Ocean?
Just a few months before the die-offs began, the meltdown of three nuclear reactors at the Fukushima Daiichi Complex in Japan caused the greatest pollution of the marine environment by radioactive contaminants in history. Far from over, these releases are still ongoing.
More than 400 tons of radioactive water have been flowing into the Pacific every day since the meltdowns began.
Although the full extent of the damage from Fukushima Daiichi has yet to be determined, the volume of these releases alone shows that we are dealing with something unprecedented in history.
Indigenous elders and scientific community sound the alarm
I was first alerted to the severity of the Fukushima disaster by Bay Area Indigenous Elder Zachary RunningWolf. A full-time activist and community leader in the Bay Area, RunningWolf has long campaigned for racial and environmental justice in a myriad of ways……..
For the last nine years, he has also led a four-day monthly stop driving boycott to combat global warming…
When RunningWolf ran for mayor of Berkeley in 2016, he made addressing Fukushima a central component of his campaign. For RunningWolf and many Indigenous elders concerned about the ongoing violence against Mother Earth, stopping the Fukushima nuclear crisis is of the highest priority.
Consider this call for action released in 2013 by a council of Indigenous elders called the Caretakers of Mother Earth:
“The People of the Earth understand that the Fukushima nuclear crisis continues to threaten the future of all life. We understand the full implications of this crisis even with the suppression of information and the filtering of truth by the corporate owned media and nation states. We strongly urge the media, corporations and nation states to acknowledge and convey the true facts that threaten us, so that the international community may work together to resolve this crisis, based on the foundation of truth” (emphasis added).
The deep concern expressed by RunningWolf and the Caretakers of Mother Earth about the impact of Fukushima’s radiation on the Pacific is shared by thousands of scientists. For instance, the platform adopted by the more than 5,000 scientists who make up the Society for Environmental Toxicology and Chemistry declared in 2014 that “the Fukushima nuclear accident on 11 March 2011 emerged as a global threat to marine biodiversity in the Pacific Ocean and human health in coastal communities.”
Other scientific organizations such as the Nordic Probabilistic Safety Assessment Group have gone even further. This institution – which is by no means “anti-nuclear” as it was founded by the nuclear utilities of Finland and Sweden – predicted in 2011 based on official estimates of radioactivity released into the Pacific that around 50-100 million fish would die from just one of the most deadly and prolific isotopes which had been released. ……….
Along with the unprecedented die-offs, a consistent set of symptoms frequently occurring together was observed across species:
Some of these symptoms (such as cancer, hair loss, and mutations) are well-known consequences of radiation sickness, while other more obscure ones such as high levels of parasites have been confirmed in studies of sea life to occur as a consequence of radiation. Altogether, only radiation sickness can produce such a widespread, prolonged epidemic exhibiting all these symptoms.
The genocidal impact of Fukushima radiation in the Pacific
It would be extremely foolish to assume this devastation in the Pacific Ocean will not profoundly impact human life. It is widely recognized that for numerous reasons our very survival depends on the health of the oceans, most notably because they produce the majority of the oxygen that we must breathe to live.
Native peoples, whose traditional livelihoods are often intimately bound up with the health of the ocean, are on the front line of this struggle. ……..
As aboriginal advocates have argued, the violence of nuclear contamination in desecrating their lands and culture must be recognized as a kind of cultural genocide. In this case, where the Pacific Ocean itself has been desecrated, Fukushima’s radiation must be recognized as constituting a genocidal assault on numerous Indigenous peoples’ cultures and livelihoods.
Furthermore, the radiation in Pacific seafood poses a significant health risk to the people who consume it. Estimates calculated by a wide variety of experts in nuclear power, chemistry and medicine show that this risk has been severely underestimated, and in fact more than 1 million people would die from cancer and other diseases if the consumption of radioactive Pacific seafood continues unabated.
In the Bay Area, Indigenous Blackfeet Elder RunningWolf has long been warning the public to avoid consuming Pacific seafood since even before the 2016 Berkeley mayoral race, while calling for the University of California – with its flagship campus located in Berkeley – to be held accountable for issuing no health warnings in turn.
Adults failed to take climate action. Meet the young activists stepping up, Some are calling climate change this generation’s civil rights movement. These are the young activists leading the charge, Guardian, by Adrian Horton, Dream McClinton and Lauren Aratani, 4 Mar 19,
Despite being barely two years old, the Sunrise Movement has outpaced established environmental groups in the push to radically reshape the political landscape around climate change. Closely allied with new congresswoman Alexandria Ocasio-Cortez, the youth-led Sunrise Movement has helped set out a sweepingly ambitious plan to address climate change in the form of the Green New Deal.
The movement comprises a small core team of young organizers, supported by a larger group of several hundred volunteers. The group’s elevation of the Green New Deal has clearly riled Trump, who has falsely but repeatedly claimed that the plan would result in the banning of cars, air travel and even cows.
It may be that when we no longer know what to do
we have come to our real work,
and that when we no longer know which way to go,
we have begun our real journey.
The mind that is not baffled is not employed.
The impeded stream is the one that sings.
― Wendell Berry
This is a hard piece to write, partly because we, too, are baffled. Environmental collapse, coupled with living in the sixth mass extinction, are new territory. We are still in the process of confronting the reality of living with the prospect of an unlivable planet. These thoughts emerge out of our sober forays into an uncertain future, searching for the right ways to live and serve in the present. The second reason for our reluctance to share this contemplation is anticipation of the grief, anger and fear it may trigger. We visit these chambers of the heart frequently, and know the challenges of deep feeling, particularly in a culture that denies feelings and pathologizes death.
As the unthinkable settles in our skin, the question of what to do follows closely. What is activism in the context of collapse? Professor of sustainability leadership and founder of the Institute for Leadership and Sustainability(IFLAS) at the University of Cumbria (UK) Jem Bendell’sdefinition of collapse is useful: “the uneven ending of our current means of sustenance, shelter, security … and identity.” Bendell isn’t the first to warn of collapse — NASA warned of it five years ago. Anyone who takes in the realities of our times will need to find their own relationship to the hard truths about converging environmental, financial, political and social unraveling. There are billions on the planet who are already experiencing the full direct effects of this right now. Forty percent of the human population of the planet is already affected by water scarcity. Humans have annihilated 60 percent of all animal life on the planet since 1970.
Described here, borrowing from Bendell’s analysis, are three responses to imminent collapse. The first is characterized by intensifying efforts to fix the mess we have created. The idea here is that if we just work harder, we can change the situation. The second is mitigation of inevitable suffering and loss, easing the pain and harm that is already underway. Mitigation slows the demise down, giving us the time for the third, which is adaptation to the life-threatening scenarios before us, or in Bendell’s words, “deep adaptation.”………..
Regardless of the plethora of geoengineering plans to draw down CO2 levels or reflect solar radiation back into space, the tough reality is that the effects of CO2 already present in the biosphere are irreversible, and intensifying rapidly. Barring unforeseen forces at work, a consensus of scientific research tells us that a minimum of three degrees Celsius (3°C) warming is already baked into the system under current global climate pledges………….
Anyone who thinks there is still time to wholly remedy the situation must answer the question: How do we remove all the heat that’s already been absorbed by the oceans? Invigorated activism, as heartening and important as it is, is not going to completely stem these tides.
Thus, the third level of activism, adaptation, comes into focus.
Adaptation is new territory. Here is the realm of healing, reparation (spiritual and psychological, among other ways) and collaboration. It is strangely rich with a new brand of fulfillment and unprecedented intimacy with the Earth and one another. It invites us to get to the roots of what went astray that has led us into the sixth mass extinction. Given that with even our own extinction a very real possibility, even if that worst-case scenario is to run its course, there is time left for amends, honorable completions, and the chance to reconnect in to this Earth with the utmost respect, and in the gentlest of ways………… https://truthout.org/articles/climate-collapse-is-on-the-horizon-we-must-act-anyway/
Celebrity Kim Kardashian West is calling on President Donald Trump and other government leaders to lead a cleanup of the contaminated Santa Susana Field Laboratory in the hills above San Fernando and Simi valleys, sparking enthusiasm among residents who have long demanded the action.
Kardashian, who lives in nearby Hidden Hills, demanded via Twitter Wednesday that Trump, Gov. Gavin Newsom and U.S. Energy Secretary Rick Perry help push for the clean up the former nuclear and rocket engine testing site near many Valley schools and homes.
“(The California Department of Toxic and Substance Control, or DTSC, the federal Department of Energy and NASA) promised to clean up contaminated Santa Susana Field Lab by 2017, but the job hasn’t even begun!” Kardashian West shared with nearly 60 million followers. “Time to reform DTSC, and for (the federal agency) to keep its promises.”
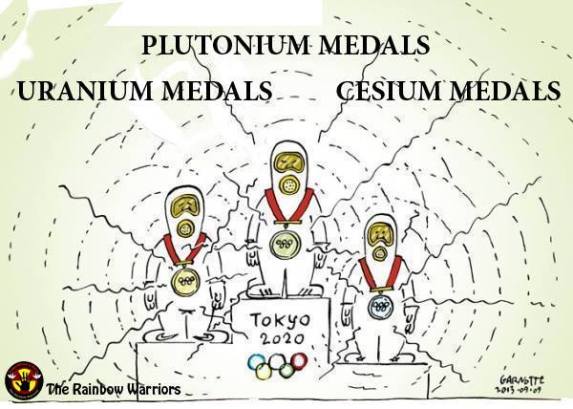
Atomic Balm Part 1: Prime Minister Abe Uses The Tokyo Olympics As Snake Oil Cure For The Fukushima Daiichi Nuclear Meltdowns March 01, 2019,Fairewinds Energy Education, By Arnie Gundersen “……….To determine whether or not Olympic athletes might be affected by fallout emanating from the disaster site, Dr. Marco Kaltofen and I were sponsored by Fairewinds Energy Education to look at Olympic venues during the fall of 2017.We took simple dirt and dust samples along the Olympic torch route as well as inside Fukushima’s Olympic stadium and as far away as Tokyo. When the Olympic torch route and Olympic stadium samples were tested, we found samples of dirt in Fukushima’s Olympic Baseball Stadium that were highly radioactive, registering 6,000 Bq/kg of Cesium, which is 3,000 times more radioactive than dirt in the US. We also found that simple parking lot radiation levels were 50-times higher there than here in the US.
With the upcoming XXXII Olympiad in 2020 hosted by Japan, it is necessary to look into the radioactivity of Olympic venues as well as tourist attractions in the host cities… Since thousands of athletes and millions of visitors are travelling to Japan for the Olympics, there has been widespread concern from the international community about radiation exposure. Therefore, it is important to investigate the extent of radioactive fallout from the Fukushima Dai-ichi incident.
The measured results showed a much higher activity of Cesium-137 in the proposed torch route compared to other areas. Overall, the further away from the Fukushima Dai-ichi Nuclear Power Plant, the lower the radioactivity. The activity of Cesium-137 in Tokyo, the furthest site from the plant, was the lowest when compared to the other sites. Therefore, the activity of Cesium-137 in Tokyo sample was used as the baseline to qualitatively estimate the human exposure to radiation.
At the Azuma Sports Park, the soil and dust samples yielded a range of 78.1 Bq/kg to 6176.0 Bq/kg. This particular Olympic venue is around 90 km from the Nuclear Power Plant. The other sites that are closer to the Nuclear Power Plant like the tourist route, proposed torch route, and non-Olympic samples have higher amounts due to the close proximity to ground zero of the disaster.
… the proposed torch route samples had the highest mean radioactivity due to their close proximity to the plant. Based on the measurement, we estimated qualitatively that the radiation exposure of people living near the Azuma Sports Park area was 20.7 times higher than that of people living in Tokyo. The main tourist and proposed torch routes had radiation exposure of 24.6 and 60.6 times higher, respectively, than in Tokyo…. Olympic officials should consider using the results of this project to decide whether the radioactivity level at the proposed torch route and the Olympic venues are within acceptable level…… https://www.fairewinds.org/demystify/atomic-balm-part-1-prime-minister-abe-uses-the-tokyo-olympics-as-snake-oil-cure-for-the-fukushima-daiichi-nuclear-meltdowns
The Ocean Is Running Out of Breath, Scientists Warn
Widespread and sometimes drastic marine oxygen declines are stressing sensitive species—a trend that will continue with climate change, Scientific American , By Laura Poppick on February 25, 2019 Escaping predators, digestion and other animal activities—including those of humans—require oxygen. But that essential ingredient is no longer so easy for marine life to obtain, several new studies reveal.
In the past decade ocean oxygen levels have taken a dive—an alarming trend that is linked to climate change, says Andreas Oschlies, an oceanographer at the Helmholtz Center for Ocean Research Kiel in Germany, whose team tracks ocean oxygen levels worldwide. “We were surprised by the intensity of the changes we saw, how rapidly oxygen is going down in the ocean and how large the effects on marine ecosystems are,” he says.
It is no surprise to scientists that warming oceans are losing oxygen, but the scale of the dip calls for urgent attention, Oschlies says. Oxygen levels in some tropical regions have dropped by a startling 40 percent in the last 50 years, some recent studies reveal. Levels have dropped more subtly elsewhere, with an average loss of 2 percent globally.
Ocean animals large and small, however, respond to even slight changes in oxygen by seeking refuge in higher oxygen zones or by adjusting behavior, Oschlies and others in his field have found. These adjustments can expose animals to new predators or force them into food-scarce regions. Climate change already poses serious problems for marine life, such as ocean acidification, but deoxygenation is the most pressing issue facing sea animals today, Oschlies says. After all, he says, “they all have to breathe.”
Private firms jolted by beach sand mining ban, Times of India M K Ananth , 24 Feb 19, MADURAI: Environmentalists fighting against rampant illegal sand mining have hailed the gazette notification by the Union ministry of mines changing the rules that earlier allowed private companies to mine rare earth minerals found on beach sand. They said the notification was much awaited and would help save the coastal treasures.
Activist Lal Mohan of Kanyakumari said rampant mining by private players had led to erosion of the shores and many sand dunes that acted as barriers during natural disasters such as tsunami had disappeared. He accused private players of influencing officials and exploiting coastal minerals and exporting monazite.
Stating that monazite on the coast had high concentration of thorium that was considered an atomic mineral, he said research was on to use it instead of uranium. “It is to eliminate the use of uranium and the large reserve s of thorium in India. At many places, private companies have exploited thorium and exported it to Australia, China and Russia, he said… .. https://timesofindia.indiatimes.com/city/madurai/private-firms-jolted-by-beach-sand-mining-ban/articleshow/68133578.cms
Futurity FEBRUARY 19TH, 2010NERISSA HANNINK-MELBOURNEMany people believe that cockroaches could survive a nuclear bomb and the subsequent radiation exposure, but is that actually true? The creepy crawlies do have a reputation for resilience, which media reports have suggested may stem from rumors that insects thrived in the aftermath of the atomic bombings of Hiroshima and NagasakiBut Tilman Ruff, a Nobel Laureate and professor in the School of Population and Global Health at the University of Melbourne who studies the health and environmental consequences of nuclear explosions, says he has yet to see any documented evidence that there were cockroaches scuttling through the rubble.
“I’ve certainly seen photographs of injured people in Hiroshima that have lots of flies around, and you do imagine some insects would have survived,” Ruff says. “But they still would have been affected, even if they appear more resistant than humans.”
ROACHES’ BAD WRAP
The TV series Mythbusters tested the cockroach survival theory in 2012 when they exposed cockroaches to radioactive material. The roaches survived longer than humans would have, but they all died at extreme levels of radiation.
Mark Elgar, a professor at the School of Biosciences, says Mythbusters tests are incomplete because they only looked at how many days the cockroaches lived after exposure. They didn’t look at the cockroaches’ ability to produce viable eggs, thus ensuring the continued survival of the species.
“There is some evidence that they seem quite resilient to gamma rays, although they are not necessarily the most resistant across insects.”
“You could argue,” Elgar adds, “that some ants, particularly those that dig nests deep into the ground, would be more likely to survive an apocalypse than cockroaches.”
Previous tests of insects subjected to radiation found that cockroaches, though six to 15 times more resistant than humans, would still fare worse than the humble fruit fly.
Elgar says the feral American and German species of cockroach—the ones you might recognize from your kitchen nooks and crannies—have given the rest of the species a bad rap.
“I think our view of cockroaches is informed by our frequent interaction with the American and German cockroaches, which have spread throughout the world,” Elgar says. “Their habit of basically acting as an unpaid house cleaner horrifies people.”
There are more than 4,000 species of cockroaches, however, including native Australian cockroaches marked by iridescent colors and patterns……….
For a while they’ll be able to eat dead bodies and other decaying material but, if everything else has died, eventually there won’t be any food. And they’re not going to make much of a living,” Elgar says.
“The reality is that very little, if anything, will survive a major nuclear catastrophe, so in the longer term, it doesn’t matter really whether you’re a cockroach or not.”…….
“The evidence from a disaster like Chernobyl is that every organism, from insects to soil bacteria and fungi to birds to mammals, would experience effects in proportion to the degree of contamination,” Ruff says. …….
uff says that focusing on a single species misses the complexity of the biological environment and how we relate to one another, as well as interactions between multiple stresses at the same time.
“There’s all sorts of factors we have to look at. There are environmental factors. There are chronic exposures, effects across generations, and food shortages, for example,” he says. “The magnitude of effects of a nuclear explosion is far greater than what you might see in carefully controlled experiments and laboratory conditions.”
It is clear from the available empirical data that coastal populations impacted by prevailing onshore winds and living next to sea areas contaminated with liquid radioactive effluents from nuclear sites, are annually exposed to dietary and inhalation doses of man-made marine radioactivity.
Effluents discharged to the sea by nuclear power stations, fuel fabrication sites and reprocessing facilities are transferred from sea to land in airborne sea spray and marine aerosols (micro-droplets). They come in also during episodes of coastal flooding. This problem has been particularly pronounced around the UK Sellafield reprocessing and plutonium production site in Cumbria. In 1988, independent empirical research commissioned by a west Wales local authority reported that
Sellafield-derived, sea-discharged cesium had been found in pasture grass up to 10 miles inland of the Ceredigion coast.
Clearly, this contributes to human dietary doses via the dairy and beef food chain. The research also implies the inevitability of further dietary doses via arable and horticultural crops. Given that airborne radioactivity is driven at least 10 miles inland, it should be assumed that coastal populations are exposed, on a repeated annual basis, to inhalation doses. https://beyondnuclearinternational.org/2019/02/17/radioactive-sea-spray-is-dosing-communities/
Bellona 13th Feb 2019 , Norwegian authorities have reported trace amounts of radioactive iodine 131 in the atmosphere, which emerged last week in measurements taken in the country’s far northeast near the city of Tromsø. Officials with the Norwegian Radiation and Nuclear Safety Authority were at pains to emphasize that levels of the radioactive isotope were extremely low and posed no threat to human health.
But a global review of insect research has found another casualty: 40% of insect species are declining and a third are endangered. It confirms what many have been suspecting: in Australia and around the world, arthropods – which include insects, spiders, centipedes and the like — appear to be in trouble.
The global review comes hard on the heels of research published in the Proceedings of the National Academy of Sciences USA that suggests a potent link between intensifying heat waves and stunning declines in the abundance of arthropods.
If that study’s findings are broadly valid – something still far from certain – it has chilling implications for global biodiversity.
Arthropod Armageddon
In the mid-1970s, researchers on the Caribbean island of Puerto Rico conducted a large-scale study to measure the total biomass (living mass) of insects and other arthropods in the island’s intact rainforests, using sweep nets and sticky-traps.
Four decades later, another research team returned to the island and repeated the study using identical methods and the same locations. To their surprise, they found that arthropod biomass was just one-eighth to one-sixtieth of that in the 1970s – a shocking collapse overall.
And the carnage didn’t end there. The team found that a bevy of arthropod-eating lizards, birds and frogs had fallen sharply in abundance as well.
In the minds of many ecologists, a widespread collapse of arthropods could be downright apocalyptic. Arthropods pollinate some of our most important food crops and thousands of wild plant species, disperse seeds, recycle nutrients and form key links in food chains that sustain entire webs of life.
This ecological ubiquity arises because arthropods are so abundant and diverse, comprising at least two-thirds of all known species on Earth. In the 1940s, evolutionary biologist J. B. S. Haldane quipped that “God has an inordinate fondness for beetles.” Humans might think we rule the world, but the planet really belongs to arthropods.
Killer heat waves
The researchers who documented the arthropod collapse in Puerto Rico considered a variety of possible causes, including pesticides and habitat disruption. But the evidence kept pointing to another driver: rising temperatures.
Weather stations in Puerto Rico indicate that temperatures there have risen progressively in the past several decades – by 2℃ on average.
But the researchers are far less worried about a gradual increase in temperature than the intensification of heat waves—which have risen markedly in Puerto Rico. This is because nearly all living species have thresholds of temperature tolerance.
For example, research in Australia has shown that at 41℃, flying foxes become badly heat-stressed, struggling to find shade and flapping their wings desperately to stay cool.
But nudge the thermometer up just one more degree, to 42℃, and the bats suddenly die.
In November, heat waves that peaked above 42℃ in north Queensland killed off almost a third of the region’s Spectacled Flying Foxes. The ground beneath bat colonies was littered with tens of thousands of dead animals. Dedicated animal carers could only save a small fraction of the dying bats.
The El Niño connection
El Niño events – fluctuations in Pacific sea-surface temperatures that drive multi-year variations in weather across large swaths of the planet – are also part of this story. New research appears to be resolving longstanding uncertainties about El Niños and global warming.
Recent studies published in Nature and Geophysical Research Letterssuggest global warming will in fact intensify El Niños – causing affected areas to suffer even more intensively from droughts and heat waves.
And this ties back to Puerto Rico, because the researchers there believe a series of unusually intense El Niño heatwaves were the cause the arthropod Armageddon. If they’re right then global warming was the gun, but El Niño pulled the trigger.
Beyond heat waves
Puerto Rico is certainly not the only place on Earth that has suffered severe declines in arthropods. Robust studies in Europe, North America, Australia and other locales have revealed big arthropod declines as well.
So, at a planetary scale, arthropods are suffering from a wide variety of environmental insults. There’s no single reason why their populations are collapsing.
The bottom line is: we’re changing our world in many different ways at once. And the myriad little creatures that play so many critical roles in the fabric of life are struggling to survive the onslaught.
By Roger Harrabin, BBC environment analyst, 12 February 2019,
Politicians and policymakers have failed to grasp the gravity of the environmental crisis facing the Earth, a report claims.
The think-tank IPPR says human impacts have reached a critical stage and threaten to destabilise society and the global economy.
Scientists warn of a potentially deadly combination of factors.
These include climate change, mass loss of species, topsoil erosion, forest felling and acidifying oceans.
The report from the centre-left Institute for Public Policy Research says these factors are “driving a complex, dynamic process of environmental destabilisation that has reached critical levels.
“This destabilisation is occurring at speeds unprecedented in human history and, in some cases, over billions of years.”
So what is needed?
The IPPR warns that the window of opportunity to avoid catastrophic outcomes is rapidly closing.
The authors urge three shifts in political understanding: on the scale and pace of environmental breakdown; the implications for societies; and the subsequent need for transformative change.
They say since 1950, the number of floods across the world has increased by 15 times, extreme temperature events by 20 times, and wildfires seven-fold.
At least climate change features in policy discussions, they say – but other vitally important impacts barely figure.
What issues are being under-played?
Topsoil is being lost 10 to 40 times faster than it is being replenished by natural processes
Since the mid-20th Century, 30% of the world’s arable land has become unproductive due to erosion
These matters are close to home for British politicians, the authors argue, with the average population sizes of the most threatened species in the UK having decreased by two-thirds since 1970.
Nearly 85% of fertile peat topsoil in East Anglia has been lost since 1850, with the remainder at risk of being lost over next 30–60 years.
The IPPR says many scientists believe we have entered a new era of rapid environmental change.
The report warns: “We define this as the ‘age of environmental breakdown’ to better highlight the severity of the scale, pace and implications of environmental destabilisation resulting from aggregate human activity.”
Will society take the solutions on offer?
Simon Lewis, Professor of Global Change Science at University College London, told BBC News: “IPPR are right to say that environmental change is happening ever-faster and threatens to destabilise society.
“Future problems with food supplies could cause price spikes that drive civil unrest, while increases in levels of migration can strain societies.
“Both together could overload political institutions and global networks of trade.
“This century will be marked by rapid social and environmental change – that is certain. What is less clear is if societies can make wise political choices to avoid disaster in the future.”
Harriet Bulkeley, a geography professor at Durham University, told BBC News that the IPPR paper was a good interpretation of the current evidence, but she said it raised the question of how firm evidence of environmental threats had to be to prompt government action.
“We know lots of good things to do,” she said, “but often the argument is made that we need to have ‘evidence-based policy’.
“This can, of course, be used as an excuse for delay. So, I guess the question is how much more evidence is needed for action?”
A UK government spokesperson said: “We are committed to leaving our environment in a better state than we found it through our 25 Year Environment Plan and the forthcoming Environment Bill.
“Over 25 years we will replenish depleted soils, rid our seas and rivers of the rubbish trashing our planet, cut greenhouse gas emissions, cleanse our air of toxic pollutants, and develop cleaner, more sustainable energy sources.
“The Environment Bill will also create a new environmental body, the Office for Environmental Protection, to hold us to account on this commitment.”
Microanalysis of Particle-Based Uranium, Thorium, and Plutonium in Nuclear Workers’ House Dust Mary Ann Liebert Publishers , Marco Kaltofen
:4 Feb 2019
Abstract
Scanning electron microscopy and energy dispersive X-ray analysis (SEM/EDS), a technique not routinely used to detect radiation, was used to identify radioactive particulate matter in house and environmental dust. The study focused on elements that are necessarily radioactive, including thorium, plutonium, americium, and uranium. Seventy-nine dust and 31 soil and sediment samples were collected from the Hanford Nuclear Reservation, Los Alamos National Laboratory, the former Rocky Flats Plant in Colorado, and from homes of workers or abutters of these nuclear facilities. Dusts containing percent levels of uranium, plutonium, americium, and both mineral and metallic thorium were detected outside of radiation-controlled areas. These radioactive dusts are a potential source of internal radiation exposure to nuclear site workers, or to their families via secondary contamination. Uranium and thorium-containing particles were fingerprinted as either natural minerals or processed industrial particles, based on elemental composition of the microparticles. Activities of individual uranium-, thorium-, or plutonium-bearing dust particles varied by five orders of magnitude, ranging from <0.005 mBq (millibecquerel) to 2,270 mBq. Hanford workplace dusts also had up to 564 ± 24 Bq/kg of137Cs. SEM/EDS techniques reliably detected environmental radioactivity in samples that had barely detectable results by gamma spectrometry. The technique was able to definitively show that thorium, plutonium, and uranium from nuclear facilities could be found in general population settings outside of radiation protection zones…………..
Conclusions
Dusts in this study contained radioactive particles of uranium, thorium, plutonium, and americium. This study found monazites, uranium mineral, and Th-P-REE particles that were likely of natural origin and industrial (plutonium-containing, metallic or metal oxide) radioactive microparticles.
Dust in the homes of workers and neighbors of Hanford, Los Alamos, and the former Rocky Flats nuclear facility contained radioactive microparticles connected to these sites. This creates potential radiation exposures outside of radiological protection zones. Given the small respirable size of these radioactive microparticles, they are a potential source of internal exposure from inhalation or ingestion.
SEM/EDS coupled with gamma spectroscopy and autoradiography proved a useful technique for distinguishing the origins of particulate-based radioisotopes that have both industrial and natural sources. Micron-sized radioactive industrial particles were detected in samples that had gross activity levels that were near background. This is an especially useful tool for nuclides, such as uranium and thorium, which have both natural and industrial sources. SEM/EDS distinguished metallic (more likely industrial) versus mineral (more likely natural or mining-related) forms of these elements by determining the complete elemental composition of each particle. https://www.liebertpub.com/doi/10.1089/ees.2018.0036?utm_source=sfmc&utm_medium=email&utm_campaign=EES+FP+Feb+8+2019&d=2%2F8%2F2019&mcid=83805056&
The returning residents of Fukushima’s nuclear disaster
Near site of Fukushima nuclear disaster, a shattered town and scattered lives, WP, By Simon Denyer, February 3 2019 NAMIE, Japan — Noboru Honda lost 12 members of his extended family when a tsunami struck the Fukushima prefecture in northern Japan nearly eight years ago. Last year, he was diagnosed with cancer and initially given a few months to live.
Today, he is facing a third sorrow: Watching what may be the last gasps of his hometown.
For six years, Namie was deemed unsafe after a multiple-reactor meltdown at the Fukushima Daiichi Nuclear Power Plant following a 2011 earthquake and tsunami.
In March 2017, the government lifted its evacuation order for the center of Namie. But so far, hardly anyone has ventured back.
Its people are scattered and divided. Families are split. The sense of community is coming apart.
“It has been eight years; we were hoping things would be settled now,” the 66-year-old Honda said. “This is the worst time, the most painful period.”
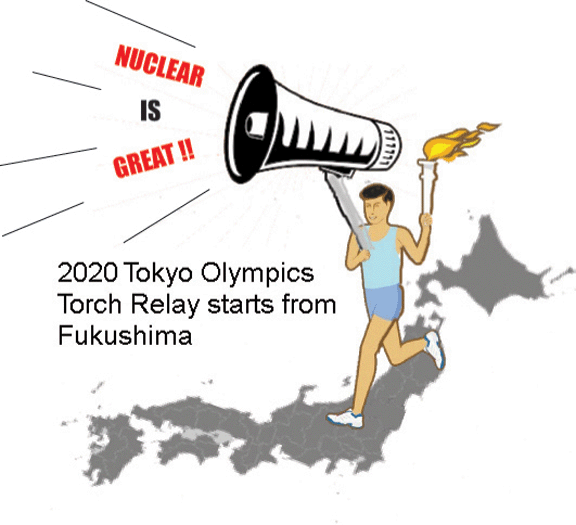
For the people of Namie and other towns near the Fukushima plant, the pain is sharpened by the way the Japanese government is trying to move beyond the tragedy, to use the 2020 Tokyo Olympics as a symbol of hope and recovery,a signthat life can return to normal after a disaster of this magnitude.
Its charm offensive is also tied up with efforts to restart the country’s nuclear-power industry, one of the world’s most extensive networks of atomic power generation.
Six Olympic softball games and a baseball game will be staged in Fukushima, the prefecture’s bustling and radiation-free capital city, and the Olympic torch relay will start from here.
But in Namie, much closer to the ill-fated nuclear plant, that celebration rings hollow, residents say.
This was a close-knit community of farmers, fishermen and potters — of orchards, rice paddies and cattle sandwiched between the mountains and the sea. It was a place where people celebrated and mourned as a community, and families lived together across generations.
That’s all gone. On the main street, a small new shopping arcade has opened. But a short walk away, a barber shop stands abandoned, its empty chairs gathering years of dust. A sign telling customers to make themselves at home is still displayed in a bar, but inside debris litters the floor. A karaoke parlor is boarded up. Wild boars, monkeys and palm civets still roam the streets, residents say.
Just 873 people, or under 5 percent, of an original population of 17,613 have returned. Many are scared — with some obvious justification — that their homes and surroundings are still unsafe. Most of the returnees are elderly. Only six children are enrolled at the gleaming new elementary school. This is not a place for young families.
Four-fifths of Namie’s geographical area is mountain and forest, impossible to decontaminate, still deemed unsafe to return. When it rains, the radioactive cesium in the mountains flows into rivers and underground water sources close to the town.
Greenpeace has been taking thousands of radiation readings for years in the towns around the Fukushima nuclear plant. It says radiation levels in parts of Namie where evacuation orders have been lifted will remain well above international maximum safety recommendations for many decades, raising the risks of leukemia and other cancers to “unjustifiable levels,” especially for children.
In the rural areas around the town, radiation levels are much higher and could remain unsafe for people to live beyond the end of this century, Greenpeace concluded in a 2018 report.
“The scale of the problem is clearly not something the government wants to communicate to the Japanese people, and that’s driving the whole issue of the return of evacuees,” said Shaun Burnie, senior nuclear specialist with Greenpeace. “The idea that an industrial accident closes off an area of Japan, with its limited habitable land, for generations and longer — that would just remind the public why they are right to be opposed to nuclear power.”
Today, Namie’s former residents are scattered across all but one of Japan’s 47 prefectures. Many live in the nearby town of Nihonmatsu, in comfortable but isolating apartment blocks where communal space and interaction are limited. With young people moving away, the elderly, who already feel the loss of Namie most acutely, find themselves even more alone.
A surprising new picture of ocean circulation could have major consequences for climate science, Some experts say the Atlantic Ocean circulation is already slowing down — but we’re just beginning to learn how it really works, WP By Chris Mooney, January 31 2019
It may be the biggest wild card in the climate system. Scientists have long feared that the so-called “overturning” circulation in the Atlantic Ocean could slow down or even halt due to climate change — a change that would have enormous planetary consequences.
But at the same time, researchers have a limited understanding of how the circulation actually works, since taking measurements of its vast and remote currents is exceedingly difficult. And now, a major new research endeavor aimed at doing just that has suggested a dramatic revision of our understanding of the circulation itself.
A new 21-month series of observations in the frigid waters off Greenland has led to the discovery that most of the overturning — in which water not only sinks but returns southward again in the ocean depths — occurs to the east, rather than to the west, of the enormous ice island. If that’s correct, then climate models that suggest the circulation will slow as the climate warms may have to be revised to take this into account.
……….. The new results come from the $ 32 million OSNAP, or “Overturning in the Subpolar North Atlantic,” program, the first attempt to comprehensively measure the circulation in the exceedingly remote regions in question. These icy seas, it is believed, are where cold, salty waters — which are extremely dense — sink below the sea surface into the depths, and then travel back southward again all the way to the Southern Hemisphere.
This “overturning” process is crucial because the sinking in the North Atlantic effectively pulls more warm, salty water northward via a system of currents that includes the Gulf Stream. This heat delivery, in turn, shapes climate throughout much of the region, and especially in Europe.
Better understanding of how the circulation works is key, since some scientists have already proposed that it is slowing down, with major consequences, including ocean warming and sea level rise off the U.S. east coast.
Global temperature maps in recent years have shown a strange area of anomalously cold temperatures in the ocean to the southeast of Greenland, along with very warm temperatures off the coast of New England.
The cold region — which has been dubbed the “cold blob” and also “warming hole” — is strikingly anomalous at a time when the Earth and its oceans are otherwise warming. And the suggestion has been that this represents a decline in the volume of heat being transported northward by the circulation.
Join the Nuclear Bombs Never Again webinar on August 4th at 5pm Pacific Time / 8pm Eastern Time / 9am Japan Standard Time.
Cross generational voices at the intersection of Japan-Korea-US policy and militarization will share their lived experiences, nuclear impacts in these contexts, anti-war strategies, and actions you can take to advocate for a world with Nuclear Bombs Never Again. This 75-minute event is co-hosted by WILPF US and Korea Peace Now.