Nuclear power’s quarter-century of stagnation has no end in sight, and has been overtaken by solar PV

Jim Green, Oct 1, 2026, https://reneweconomy.com.au/nuclear-powers-quarter-century-of-stagnation-has-no-end-in-sight-and-has-been-overtaken-by-solar-pv/
The annual World Nuclear Industry Status Report has been released. Across 596 pages it details the glum state of nuclear power worldwide.
As of 1 July 2026, a total of 411 power reactors were operating in 31 countries, up three from a year prior, but still 27 fewer than the historic peak of 438 reactors in 2002. Another 30 reactors are in long-term outage, including 18 in Japan.
As of the end of 2025, operating nuclear capacity stood at 369 gigawatts (GW) and as of mid-2026 the figure reached 375 GW. That’s a record — something for the industry to celebrate.
But in fact nuclear power has been stagnant for a quarter-century and there’s no possibility that there will be significant growth in the foreseeable future. That contrasts sharply with the renewables’ records being broken every year due to strong, sustained growth.
In 2025, the world nuclear fleet generated a record 2,703 net terawatt-hours (TWh) of electricity, a 1.1 percent annual increase but a drop of 0.2 percent outside of China. Global nuclear generation exceeded the 2006 record by a modest 40 TWh in 2025, but outside of China it fell 369 TWh below the 2006 level — a 14 percent drop.
Nuclear power’s share of global electricity generation fell from 9 percent to 8.8 percent in 2025, the lowest value in nearly half a century.
The current nuclear share is just half the peak of 17.5 percent in 1996 and further decline is certain. Conversely, the International Energy Agency projects that the share of renewables in global electricity generation will rise from 32 percent in 2024 to 43 percent by 2030.
Reactor startups vs closures
In 2025, four reactors were connected to the grid, two in China and one each in India and Russia.
In the first half of 2026, two reactors were connected to the grid, both in China. Seven reactors were permanently closed in 2025, with no further closures in the first half of this year. So there was a net decline of one reactor over 18 months — a sobering thought for those celebrating nuclear power’s recent records.
Fourteen countries are building power reactors, down from 16 as of mid-2023 but up from 11 as of mid-2025 with construction starts in Canada, Hungary, and Uzbekistan. Seven percent of the world’s countries are building reactors; 93 percent are not. Thirty years ago, 32 countries operated power reactors; now it is 31 countries.
Four countries are building their first reactor — Bangladesh, Egypt, Türkiye and Uzbekistan. All four projects are being built by the Russian nuclear industry.
Of the 16 reactors connected to the grid in nine countries in the three years from 2023-2025, the average time between construction start and grid connection was 10.9 years. Or 9.1 years if an outlier is excluded.
Sluggish growth, ongoing stagnation or slow decline?
There were 12 reactor construction starts in 2025 — nine in China, two in Russia, and one in South Korea — plus another eight in the first half of 2026. As of 1 July 2026, 73 reactors were under construction, 10 more than a year prior and the highest number since 1987.
That is less than one-third of the 234 reactors listed as under construction in 1979, but the number is higher than in recent years and, if sustained, the industry can look forward to sluggish growth instead of ongoing stagnation or slow decline. Of the 73 reactor construction projects, 37 are in China and 36 elsewhere.
The average age of operating reactors has been increasing since 1984 and as of mid-2026 stands at 32.9 years. More than a third of the world’s reactors have operated for at least 41 years. In 12 of the 31 countries operating reactors, the average age is over 40.
Of the 29 reactors permanently closed in the five-year period from 2021-25, the mean age at closure was 44.2 years. The ageing of the reactor fleet means that just to maintain its long pattern of stagnation, the industry will have to build reactors at a greater rate to match the greater rate of closures.
This problem of ageing reactors is particularly acute for Australia’s AUKUS partners, the UK and the US. Unless further lifetime extensions are granted, the UK fleet will be reduced to one reactor by the end of the decade. In the US, the mean age of operating reactors (44.7 years) exceeds the mean age of reactors closed worldwide from 2021-25 (44.2 years).
In the UK, renewables (52 percent) generate more than four times as much electricity as nuclear reactors (12 percent). In the US, solar and wind combined out-generated nuclear for the first time in 2025.
Russia and China dominate
Russia is by far the dominant supplier on the international market, with 29 reactors under construction as of mid-2026. Of those, seven are domestic and 22 are being built in nine other countries (China, Egypt, India, Türkiye, Bangladesh, Hungary, Iran, Uzbekistan, and Slovakia). Direct and indirect sanctions since Russia’s invasion of Ukraine in 2022 have delayed some of these projects.
Apart from Russia’s Rosatom, only France’s EDF, China’s CNNC and the US-Japan consortium GE Vernova Hitachi are building reactors abroad — for a total of four reactors compared to Russia’s 22.
Over the six years between January 2020 and the end of 2025, all 52 construction starts in the world, except one in South Korea, were implemented by the Chinese or Russian nuclear industries at home or abroad.
Small modular reactors
The World Nuclear Industry Status Report includes a chapter on global progress with small modular reactors (SMRs). But in truth there’s little progress to report.
Using the standard definition of SMRs — modular factory-line construction techniques, reactor capacity of <300 megawatts — no SMRs exist. Using a loose definition — excluding modular construction — two SMRs exist, one each in China and Russia. The combined capacity of those SMRs is around 0.2 GW. Nearly 10 times as much renewable capacity is being added every day.
Using the standard definition of SMRs, none are under construction. Using a loose definition, there are five construction projects — two in Russia and one each in China, Canada and Uzbekistan. Their combined capacity is under 1 GW. Nearly twice as much renewable capacity is being added every day.
A 2025 report by the OECD’s Nuclear Energy Agency states that “verified SMR financing announcements” outside of China and Russia total US$15.4 billion, of which US$10 billion has come from public sources. That funding is scattered across dozens of projects.
If it was consolidated into a single project, US$15.4 billion might suffice to build about 1 GW of SMR capacity. Nearly twice as much renewable capacity is being added every day.
Nuclear vs renewables
Solar PV and wind capacity grew by 510 GW (27 percent) and 159 GW (14 percent) in 2025. The UN’s International Renewable Energy Agency states that renewable capacity installed in 2025 amounted to 693 GW.
Nuclear capacity increased by 1.5 GW in 2025 including both new reactor startups and the restart of reactors in long-term outage. That’s a ratio of 462:1.
In 2021, solar and wind combined generated more electricity than nuclear for the first time. In 2025, solar and wind generated twice as much power as nuclear reactors. Solar alone out-generated nuclear in 2025 and wind power will out-generate nuclear in the next year or two.
Investments in renewables in 2025 amounted to US$690 billion. Nuclear power investments were almost 20 times lower at US$35.6 billion.
The World Nuclear Industry Status Report states:
“The battery revolution is increasingly functioning as an enabler for variable renewables. Their growth rate is spectacular. Globally, grid-scale batter“The battery revolution is increasingly functioning as an enabler for variable renewables. Their growth rate is spectacular. Globally, grid-scale battery power capacity grew by 104 GW or 79 percent in 2025, exceeding the 75-percent average Compound Annual Growth Rate (CAGR) during 2020–2025 and bringing the total power capacity from less than 17 GW in 2020 to just over 263 GW in 2025.”
China to the rescue?
Over the 20 years from 2006-2025, there were 104 reactor startups and 106 closures worldwide. Of these, 53 startups were in China with no closures. Outside of China there has been a net loss of 55 reactors with a capacity of 30.7 GW.
Even in China, the only country with a significant nuclear power expansion program, renewables are galloping far ahead. In 2025, wind (1,117 TWh) and solar (1,162 TWh — a “breathtaking” 40 percent annual increase) combined generated nearly five times as much electricity as nuclear (461 TWh).
Since 2010, the output of solar has increased by a factor of over 1,000, wind by a factor of 23, and nuclear by a factor of 6.5.
Dr Jim Green is the national nuclear campaigner with Friends of the Earth Australia and a member of the Nuclear Consulting Group.
No comments yet.
1 This Month
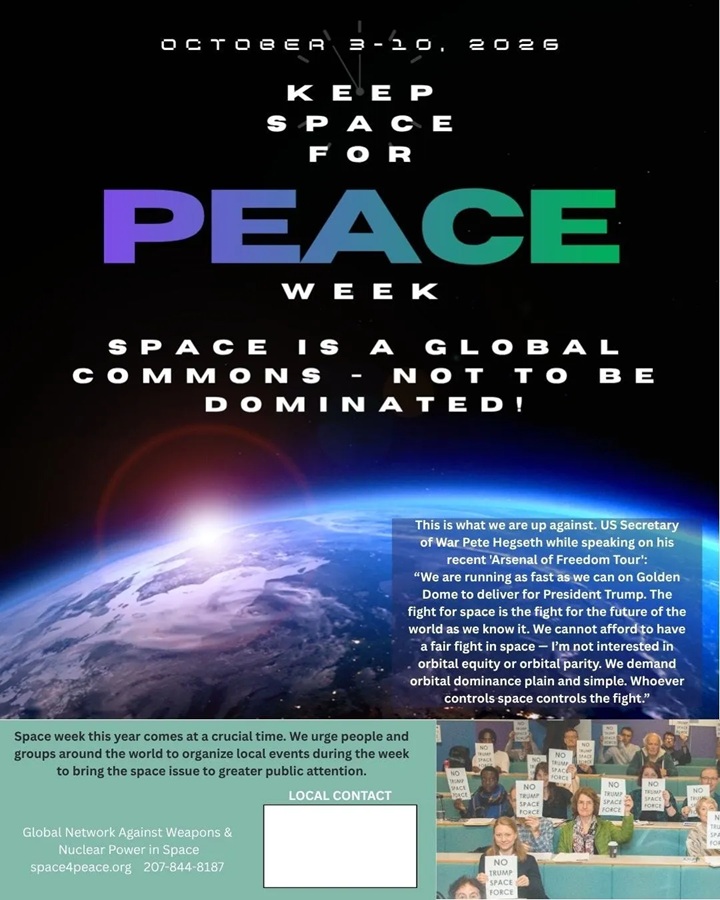


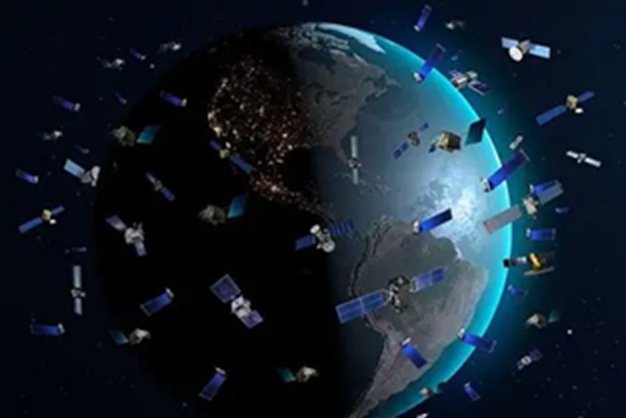
PLEASE OPPOSE HR 8255 AND S.3639 – bills would accelerate satellite deployment, with no environmental review or safeguards – https://ncstd5li.quorum.us/campaign/169331/
To see nuclear-related stories in greater depth and intensity – go to https://nuclearinformation.wordpress.com
-
Archives
- October 2026 (67)
- September 2026 (339)
- August 2026 (330)
- July 2026 (355)
- June 2026 (287)
- May 2026 (306)
- April 2026 (356)
- March 2026 (251)
- February 2026 (267)
- January 2026 (308)
- December 2025 (358)
- November 2025 (359)
-
Categories
- 1
- 1 NUCLEAR ISSUES
- business and costs
- climate change
- culture and arts
- ENERGY
- environment
- health
- history
- indigenous issues
- Legal
- marketing of nuclear
- media
- opposition to nuclear
- PERSONAL STORIES
- politics
- politics international
- Religion and ethics
- safety
- secrets,lies and civil liberties
- spinbuster
- technology
- Uranium
- wastes
- weapons and war
- Women
- 2 WORLD
- ACTION
- AFRICA
- Atrocities
- AUSTRALIA
- Christina's notes
- Christina's themes
- culture and arts
- Events
- Fuk 2022
- Fuk 2023
- Fukushima 2017
- Fukushima 2018
- fukushima 2019
- Fukushima 2020
- Fukushima 2021
- general
- global warming
- Humour (God we need it)
- Nuclear
- RARE EARTHS
- Reference
- resources – print
- Resources -audiovicual
- Weekly Newsletter
- World
- World Nuclear
- YouTube
-
RSS
Entries RSS
Comments RSS


Leave a comment