Radiation in the Ocean Food Chain, An Assessment of BioMagnification
Sunday, January 4, 2015
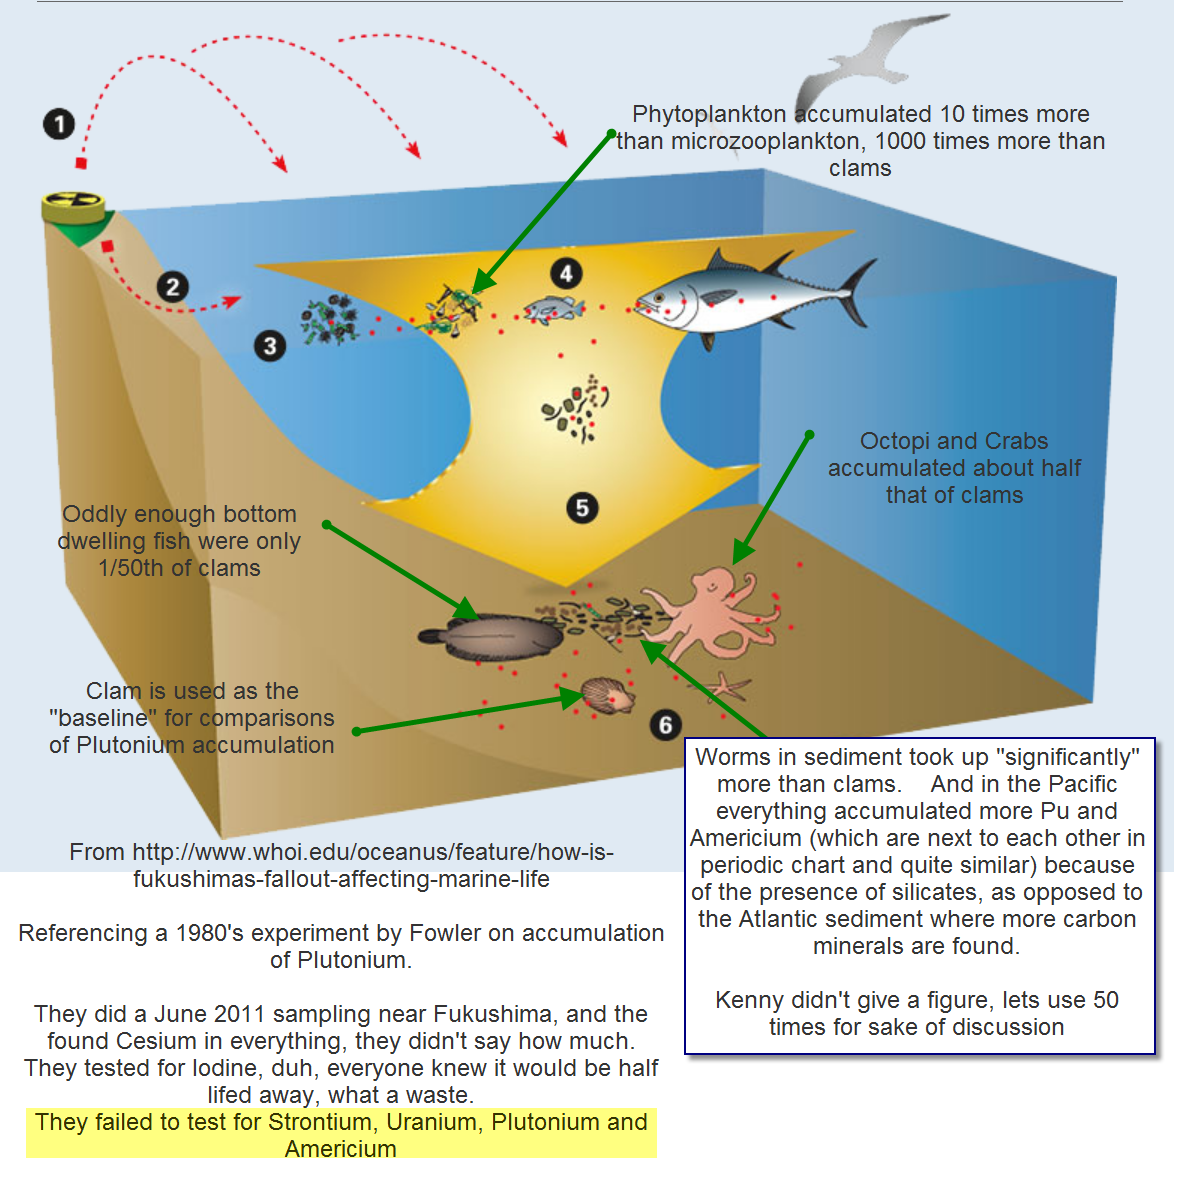
This chart is from Woods Hole. I annotated it, since their description of different rates of plutonium absorption was verbal and very hard to track, seems intentionally so.
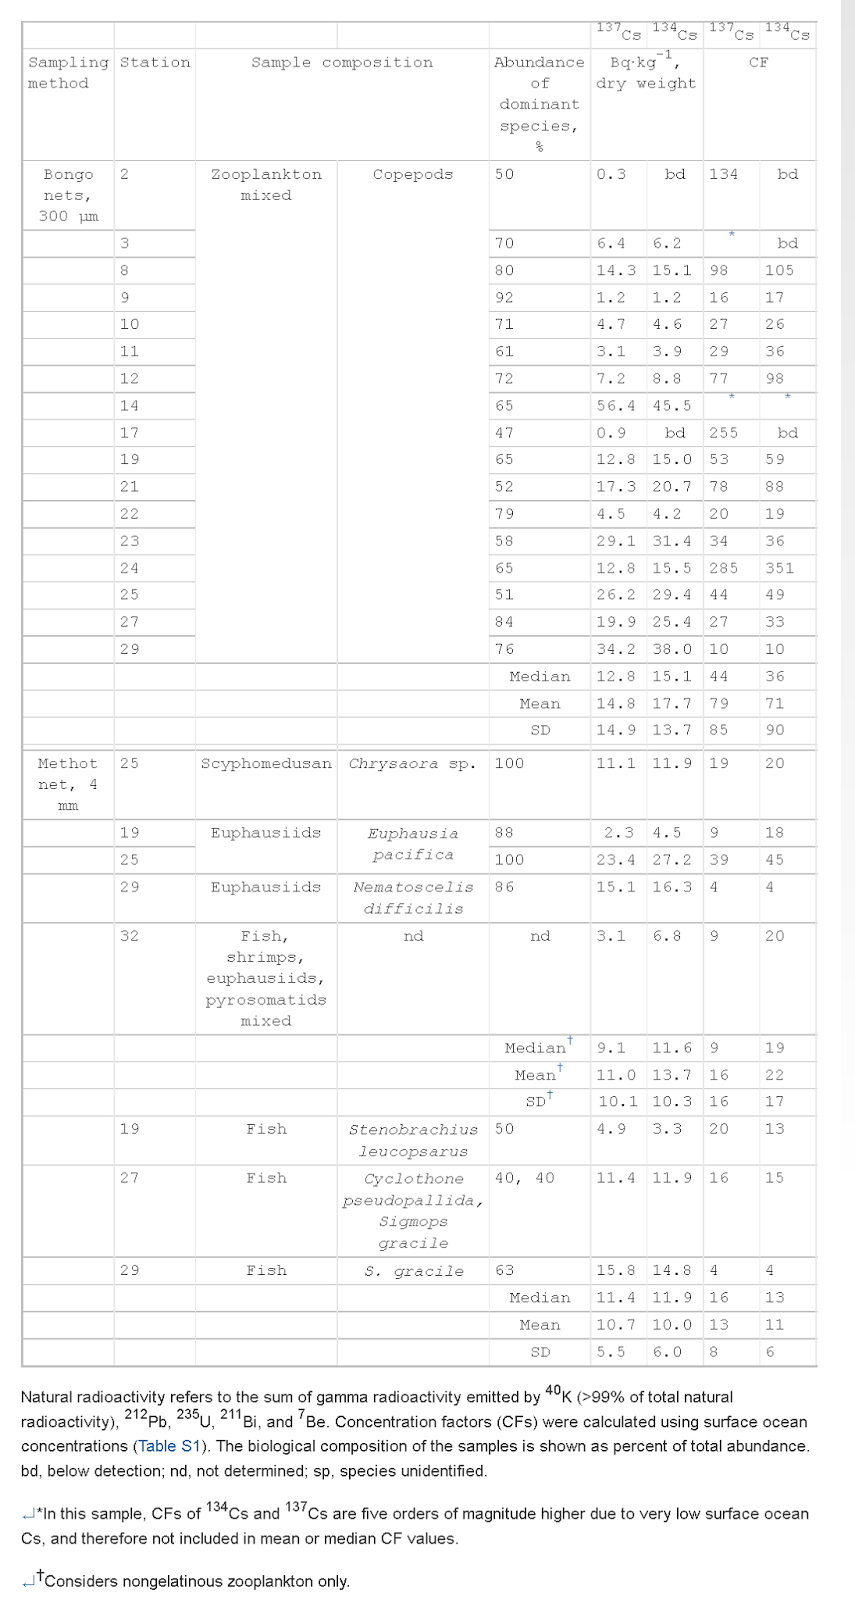
Then I tried to come up with actual radiation measurements in the water and the animal life. The link below has decent water data, and some limited fish and ocean biota.
==============================
This report from Woods Hole Oceangraphic Institute is interesting to read. Of course they always end with “Further research is needed”, LOL as giving them more money is their prime objective.
Interesting though….rather then doing testing on Marine Life, they do a lot of testing on water and they do modeling of ocean flows, and it seems a prime objective is to calculate the “source term” of what came out of Fukushima. This Source Term is an estimate of what and how many radionuclides left the buildings. Is seems odd but I guess that is what scientists do….calculate things.
But since they are in the ocean on a boat equipped with advanced radiation analysis equipment, and the ability to catch fish. It sure seems like my prime focus would be to test the fish! And the bait crops.
http://www.pnas.org/content/suppl/2012/03/27/1120794109.DCSupplemental/pnas.201120794SI.pdf#nameddest=SF1
————————————————————–
http://www.pnas.org/content/109/16/5984.full#F1
The above is the main article. You need to do quite a bit of bouncing around to get to the meat of that data.
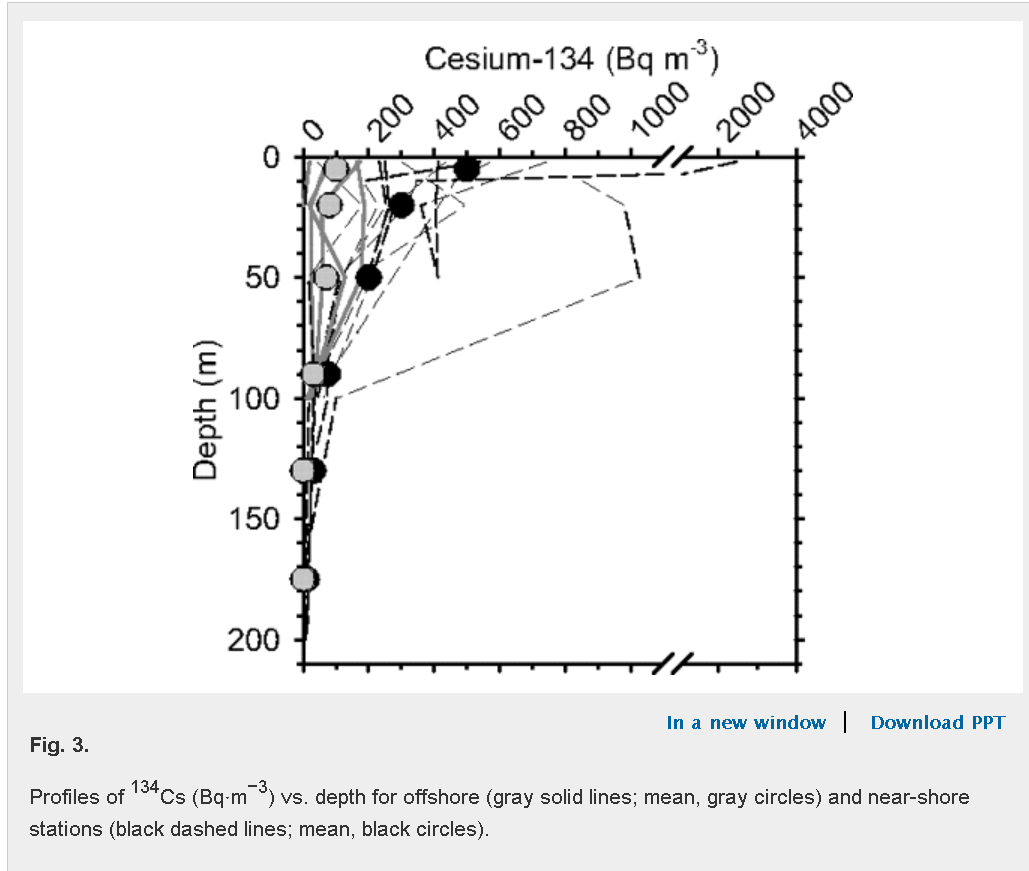
Chart below shows that contaminated water does not mix vertically much. The radiation stays in the top 300 feet primarily. It stays where 95% of the fish and critters stay. It stays where it can do the most damage.
 Finally, the bogeyman that no one wishes to speak of. Strontium. Strontium goes into bones and becomes a permanent part of the food chain.
This article states that the Strontium can be present in same levels or more, than the Cesium.
Radiostrontium in the western North Pacific: characteristics, behavior, and the Fukushima impact.
Abstract
- PMID:
- 22873743
- [PubMed – indexed for MEDLINE]
- ————————————————————————————————–
We also know this from our work on estimating the overall source term of all the nuke waste at Fukushima. The strontium is about equal to the cesium.
———————————————————–
Finally a link to some prior work I had done on the bioaccumulation, aka biomagnification on sea life in Alaska. Alaska was hit particularly hard by the Fukushima fallout, in fact, Fukushima increased the radiation in sea life the same way a direct nuclear bomb test did at point blank range.
Wrap your head around that.
From Alaska 2011 June
The soil and lichens have VERY high radioactivity. 6000 Bq /kG!
Here is the full report you can download.
https://app.box.com/s/rt4g13nxvqyljfqxmdxt
“…* Uranium-234 — 3.854 pCi/kg Dolly Varden
* Uranium-234 — 5.312 pCi/kg Goose Egg no shell
* Uranium-234 — 3.466 Ci/kg Gull egg
* Uranium-234 — 4.96 pCi/kg Chiton
* Uranium-234 — 9.344 pCi/kg Dragon Kelp
* Uranium-234 — 7.885 pCi/kg Rockweed
* Uranium-234 — 4.906 pCi/kg Greenling
* Uranium-234 — 2.304 pCi/kg Halibut
* Uranium-234 — 58.721 pCi/kg Horse Mussel tissue
* Uranium-234 — 8.86 pCi/kg Irish Lord
* Uranium-234 — 7.127 pCi/kg Octopus
* Uranium-234 — 4.976 pCi/kg Pacific Cod
* Uranium-234 — 4.644 pCi/kg Rockfish
* Uranium-234 — 3.032 pCi/kg Reindeer Lichen
* Uranium-234 — 3.906 pCi/kg Sea Urchin
* Plutonium-239 — .039 pCi/kg Dolly Varden
* Plutonium-239 — .186 pCi/kg Goose Egg no shell
* Plutonium-239 — .104 pCi/kg Gull egg
* Plutonium-239 — .298 pCi/kg Chiton
* Plutonium-239 — .093 pCi/kg Dragon Kelp
* Plutonium-239 — .084 pCi/kg Rockweed
* Plutonium-239 — .379 pCi/kg Greeling
* Plutonium-239 — .038 pCi/kg Halibut
* Plutonium-239 — 4.194 pCi/kg Horse Mussel tissue
* Plutonium-239 — .378 pCi/kg Irish Lord
* Plutonium-239 — .036 pCi/kg Octopus
* Plutonium-239 — .05 pCi/kg Pacific Cod
* Plutonium-239 — .279 pCi/kg Rockfish
* Plutonium-239 — .152 pCi/kg Reindeer Lichen
* Plutonium-239 — .195 pCi/kg Sea Urchin
* Plutonium-240 — .039 pCi/kg Dolly Varden
* Plutonium-240 — .106 pCi/kg Goose Egg no shell
* Plutonium-240 — .069 pCi/kg Gull egg
Source: Nuke Pro
http://nukeprofessional.blogspot.fr/2015/01/radiation-in-ocean-food-chain.html
* Plutonium-240 — .149 pCi/kg Chiton
* Plutonium-240 — .037 pCi/kg Dragon Kelp
* Plutonium-240 — .02 pCi/kg Rockweed
* Plutonium-240 — .189 pCi/kg Greeling
* Plutonium-240 — .012 pCi/kg Halibut
* Plutonium-240 — 2.097 pCi/kg Horse Mussel tissue
* Plutonium-240 — .189 pCi/kg Irish Lord
* Plutonium-240 — .021 pCi/kg Octopus
* Plutonium-240 — .015 pCi/kg Pacific Cod
* Plutonium-240 — .139 pCi/kg Rockfish
* Plutonium-240 — .091 pCi/kg Reindeer Lichen
* Plutonium-240 — .117 pCi/kg Sea Urchin
1 Comment »
Leave a comment
1 This Month


Tell the Ukrainian Government to Drop Prosecution of Peace Activist Yurii Sheliazhenko

Petition to revoke the licensing of the Near Surface Nuclear Disposal Facility (NSDF) at Chalk River. https://www.ourcommons.ca/petitions/en/Petition/Details?Petition=e-7247

of the week – STOP SMALL MODULAR REACTORS IN CANADA
To see nuclear-related stories in greater depth and intensity – go to https://nuclearinformation.wordpress.com
-
Archives
- March 2026 (204)
- February 2026 (268)
- January 2026 (308)
- December 2025 (358)
- November 2025 (359)
- October 2025 (376)
- September 2025 (258)
- August 2025 (319)
- July 2025 (230)
- June 2025 (348)
- May 2025 (261)
- April 2025 (305)
-
Categories
- 1
- 1 NUCLEAR ISSUES
- business and costs
- climate change
- culture and arts
- ENERGY
- environment
- health
- history
- indigenous issues
- Legal
- marketing of nuclear
- media
- opposition to nuclear
- PERSONAL STORIES
- politics
- politics international
- Religion and ethics
- safety
- secrets,lies and civil liberties
- spinbuster
- technology
- Uranium
- wastes
- weapons and war
- Women
- 2 WORLD
- ACTION
- AFRICA
- Atrocities
- AUSTRALIA
- Christina's notes
- Christina's themes
- culture and arts
- Events
- Fuk 2022
- Fuk 2023
- Fukushima 2017
- Fukushima 2018
- fukushima 2019
- Fukushima 2020
- Fukushima 2021
- general
- global warming
- Humour (God we need it)
- Nuclear
- RARE EARTHS
- Reference
- resources – print
- Resources -audiovicual
- Weekly Newsletter
- World
- World Nuclear
- YouTube
-
RSS
Entries RSS
Comments RSS

Buessler wrote his Ph.D. dissertation on testing for Plutonium – I think he wrote about Pu in the Black Sea after Chernobyl. He also worked at the Savannah River site. So, he knows how to test for Pu and how to do it! He needs to be called on that! Notice how when he tells untruths his sniffing seems to speed up? WHOI is part of MIT – Buessler has a dual WHOI-MIT doctorate, which is already weird. Universities are not supposed to keep their own. Moniz, pro-nuclear head of the DOE is an MIT prof. The Alaska island, Amchitka, is both towards Japan and it was the site of US underground nuclear testing. Howard Hughs complained that bombs disturbed his sleep so they did one test in Mississippi and one in Alaska. There is some discussion of Fukushima in the document. They have to test the site to see if it is leaking. So, there is a mixture of sources – from Fukushima and from the nuclear tests at Amchitka and elsewhere in the Pacific. They should be able to sort out bombs vs. Fukushima vs. Chernobyl according to the various ratios, but probably have not. The Cs 134 would have to be new. The world is already more contaminated than people have known. So, it’s not just Fukushima. It is Fukushima and. That is why Fukushima can indeed destroy everything. There is all the old stuff that’s gone no place plus Fukushima. They love to test Cesium 134 because it has a short half-life, then the Cs 137 with a slightly longer, but rarely the plutonium. The plutonium tends to move more slowly, due to its weight, according to research regarding Sellafield.
They know it is complex and take advantage. They know it is dangerous.