Greenhouse gas volumes reached new high in 2011 – survey
“Is there a connection between these mass releases of isotopes into the atmosphere and the interesting temperature peaks? and how do we get the highest CO releases, lowest temperature globally and highest recorded ever temperatures in some parts of the world including the Arctic?”
GENEVA | Tue Nov 20, 2012 10:41am GMT
(Reuters) – Atmospheric volumes of greenhouse gases blamed for climate change hit a new record in 2011, the World Meteorological Organization (WMO) said in its annual Greenhouse Gas Bulletin on Tuesday.
The volume of carbon dioxide, the primary greenhouse gas emitted by human activities, grew at a similar rate to the previous decade and reached 390.9 parts per million (ppm), 40 percent above the pre-industrial level, the survey said.
It has increased by an average of 2 ppm for the past 10 years.
Fossil fuels are the primary source of about 375 billion tonnes of carbon that has been released into the atmosphere since the industrial era began in 1750, the WMO said.
WMO Secretary-General Michel Jarraud said the billions of tonnes of extra carbon dioxide would stay in the atmosphere for centuries, causing the planet to warm further.
“We have already seen that the oceans are becoming more acidic as a result of the carbon dioxide uptake, with potential repercussions for the underwater food chain and coral reefs,” he said in a statement.
Levels of methane, another long-lived greenhouse gas, have risen steadily for the past three years after levelling off for about seven years. The reasons for that evening out are unclear.
Growth in volumes of a third gas, nitrous oxide, quickened in 2011. It has a long-term climate impact that is 298 times greater than carbon dioxide.
The WMO, the United Nations’ weather agency, said the three gases, which are closely linked to human activities such as fossil fuel use, deforestation and intensive agriculture, had increased the warming effect on the climate by 30 percent between 1990 and 2011.
The prevalence of several less abundant greenhouse gases was also growing fast, it said.
Sulphur hexafluoride, used as an electrical insulator in power distribution equipment, had doubled in volume since the mid-1990s, while hydrochlorofluorocarbons (HCFCs) and hydrofluorocarbons (HFCs) were growing at a rapid rate from a low base.
But chlorofluorocarbons (CFCs) and most halons were decreasing, it said.
(Reporting by Tom Miles; Editing by Lisa Shumaker)

http://www.ncdc.noaa.gov/sotc/global/2011/13
Note the increase from 1986 (chernobyl)
NOAA data
Note the increase from 2011 (Fukushima Daichi)
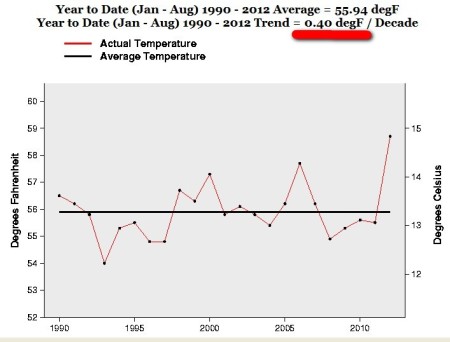
Though globally in 2012 we have seen an unusual drop in temperature

http://wattsupwiththat.com/2012/06/10/a-big-picture-look-at-earths-temperature-peter-gleick-edition/
Is there a connection between these mass releases of isotopes into the atmosphere and the interesting temperature peaks? and how do we get the highest CO releases, lowest temperature globally and highest recorded ever temperatures in some parts of the world including the Arctic?
[…]
Bulgaria experienced record high temperatures during October. Five new records for daily maximum temperatures were set on October 1st in the cities of Lovech, Blagoevgrad, Dragoman, Sofia, and Shabala, ranging from 34.9°C (94.8°F) to 25.4°C (77.7°F). Moreover, the records were part of a multi-day streak (begun during September) of unusually warm autumn temperatures, as strong southerly winds blew across the country. On October 16thseven new daily maximum temperature records were set, while on October 28th new extremes occurred at five locations, according to media reports.
[…]

Remnants of Arctic sea ice that drifted along the east coast of Greenland in mid-October produced a pattern of swirls as viewed by satellite. The volume of Arctic ice has declined as the thickness of the ice decreased — a result of a lessening of multi-year ice.

Over the past year, scientists continued to monitor cracks along the West Antarctic ice sheet. NASA has conducted annual airborne surveys of polar ice since 2009 as part of a six-year mission known as Operation IceBridge. A highly specialized fleet of research aircraft outfitted with a sophisticated suite of innovative science instruments collects data for studying changes in thickness of sea ice, glaciers, and ice sheets. A second crack developed in May 2012 alongside a massive rift that was initially detected in October 2011 on the Pine Island Glacier (PIG) ice shelf. The new iceberg, which will ultimately split from the PIG as the rift lengthens, is anticipated to be the largest in several decades.
[…]
http://www.ncdc.noaa.gov/sotc/hazards/2012/10
And of course there could be many factors at work here. Here is one..
Louisiana Sinkhole? -Gulf Stream Shift Linked to Methane Gas Escaping from Seabeds
“The new work could reinvigorate a debate on the risk of methane release from the oceans and whether destabilized hydrates make the continental slopes more unstable”
No comments yet.
1 This Month

of the week – Shut Down Drone Warfare!

Tell the Ukrainian Government to Drop Prosecution of Peace Activist Yurii Sheliazhenko

Petition to revoke the licensing of the Near Surface Nuclear Disposal Facility (NSDF) at Chalk River. https://www.ourcommons.ca/petitions/en/Petition/Details?Petition=e-7247
To see nuclear-related stories in greater depth and intensity – go to https://nuclearinformation.wordpress.com
-
Archives
- April 2026 (114)
- March 2026 (251)
- February 2026 (268)
- January 2026 (308)
- December 2025 (358)
- November 2025 (359)
- October 2025 (376)
- September 2025 (257)
- August 2025 (319)
- July 2025 (230)
- June 2025 (348)
- May 2025 (261)
-
Categories
- 1
- 1 NUCLEAR ISSUES
- business and costs
- climate change
- culture and arts
- ENERGY
- environment
- health
- history
- indigenous issues
- Legal
- marketing of nuclear
- media
- opposition to nuclear
- PERSONAL STORIES
- politics
- politics international
- Religion and ethics
- safety
- secrets,lies and civil liberties
- spinbuster
- technology
- Uranium
- wastes
- weapons and war
- Women
- 2 WORLD
- ACTION
- AFRICA
- Atrocities
- AUSTRALIA
- Christina's notes
- Christina's themes
- culture and arts
- Events
- Fuk 2022
- Fuk 2023
- Fukushima 2017
- Fukushima 2018
- fukushima 2019
- Fukushima 2020
- Fukushima 2021
- general
- global warming
- Humour (God we need it)
- Nuclear
- RARE EARTHS
- Reference
- resources – print
- Resources -audiovicual
- Weekly Newsletter
- World
- World Nuclear
- YouTube
-
RSS
Entries RSS
Comments RSS

Leave a comment